
Validity of hand antisepsis adherence observations as a method for measuring and improving adherence – quantifying and visualizing the Hawthorne effect
Cornelius Rahe 1Martin Exner 2
Claudius Kruse 1
1 Clinic for Anaesthesiology and Intensive Care Medicine Franziskus Hospital Bielefeld, Bielefeld, Germany
2 Institute for Hygiene and Public Health, University of Bonn, and German Society for General and Hospital Hygiene, e.V., Berlin, Germany
Abstract
Aim: Evaluate how well hand antisepsis adherence observations measure or increase adherence.
Method: A prospective observational study using double-blinded Wi-Fi-based dispenser recordings and overt adherence observations was conducted in an intensive care unit at a German university teaching hospital. The study was part of a multimodal approach aimed at improving hand hygiene. During the six-week study period, Wi-Fi hand sanitizers recorded every hand antisepsis event in each room. A highly trained health science student conducted ten standardized, non-covert observation sessions in selected ICU rooms, each lasting two and a half hours.
Results: A total of 3,957 hand antisepsis events were recorded. A Student’s t-test revealed significant differences in the number of hand antisepsis events per patient during adherence monitoring compared to days without observations. Observed adherence was 70%. The Hawthorne effect was quantified and showed that observed adherence must be reduced by approximately 24% to determine real, uninfluenced adherence, which was 53%. As soon as adherence monitoring begins, adherence levels rise, and immediately after monitoring ends, they drop back down to exactly the same level as before. Adherence observations had much less influence on the amount of hand sanitizer used.
Conclusions: With Wi-Fi recording of hand sanitization events, the transient Hawthorne effect during hand hygiene adherence observations and real, everyday adherence could be quantified. The results showed that even with a multimodal approach that included adherence monitoring and feedback, no further improvement could be achieved in a hospital that had been focusing on hand hygiene for many years.
Keywords
hand antisepsis, hand sanitizers, guideline adherence, hawthorne effect, intensive care units, infection control
Introduction
Monitoring adherence with hand antisepsis is one of the most important internal quality measures in hospitals according to the World Health Organization (WHO) and National Health Authorities (NHAs) and highly recommended in many countries [1], [2]. Adherence observations serve as a monitoring tool and as a central component of a multimodal approach to improving adherence. This approach also includes other measures, such as optimizing the placement of hand antiseptic dispensers, signage, education, electronic monitoring [3], [4], [5], [6] and feedback [1]. Adherence observations are typically made by infection control professionals who determine the number of hand antisepsis events (HAE) performed according to the five World Health Organization (WHO) indications, thereby quantifying adherence [1].
However, scientific publications are increasingly pointing out the shortcomings of adherence observation as a way to monitor adherence and to improve adherence. Studies on hand antisepsis have shown that the act of observation itself has an increasing impact on adherence [7], [8], [9], [10]. During observation, the Hawthorne effect [11] increases the adherence of the observed staff, but after observation, when the observer was absent, adherence returned to approximately baseline [7], [12], [13].
Technical solutions are said to improve the adherence, too [14]. WI-FI-controlled hand antiseptic dispensers track and record every use, along with information such as which dispenser was used, when it was used, and how much was dispensed. The dispensers then transmit this information wirelessly to a server via Wi-Fi. The server can cross-reference this data with information from the hospital information system. For example, it can determine how many patients were in the room where the hand sanitizer was dispensed [10], [15]. It is under discussion, however, if this technical intervention can increase hand antisepsis adherence on its own [10].
The scheduled aim of this study was to develop an efficient method for adherence studies even under the conditions of a fluctuating level of attendance during the daily routine work. Furthermore, the study wanted to assess if adherence observations and/or WI-FI-controlled hand antiseptic dispensers could increase the adherence long term and to quantify the Hawthorne effect.
Methods
Preparatory study phase
For many years, the study hospital has used a multimodal approach to improve adherence to hand hygiene guidelines. This approach includes providing alcohol-based hand rub at the point of care, offering regular training and education on the importance of hand hygiene and proper technique, monitoring hand sanitizer consumption per ward, observing adherence by hygiene specialists and providing feedback, placing reminders in the workplace, and fostering an institutional safety culture.
Immediately prior to the study, intensive care unit (ICU) staff underwent additional specialized training on hand antisepsis. This training included feedback on hand antiseptic consumption and observations of adherence in the ICU. The number and placement of the hand antiseptic sanitizers were optimized using the data of the WI-FI dispensers.
Study design
Prospective observational study using double-blinded Wi-Fi-based dispenser recordings and overt adherence observations. The clinical personnel but not the study personnel were blinded regarding the results of the overt adherence observations; nobody was blinded regarding times and rooms of the adherence observations.
Setting
The study was conducted in the ICU of a German university teaching hospital with 8 rooms of 2 beds each.
Wi-Fi dispenser
The ingo-man antiseptic dispensers (IMP ELS A/24 WECO without antenna, Ophardt Germany) contained alcohol-based hand antiseptic solutions. The number and placement of the hand antiseptic sanitizers were optimized. There were two antiseptic dispensers in each room and two more outside of each room relevant to the data analysis. The hand antisepsis events were assigned to the specific location and time and the number of patients in each room assessed by the hospital information system. The events were set in relation to the patient days. Thus, the events of one specific hour were expressed as values per patient. Each time a dispenser was operated by pushing down the dispensing lever, a hand antisepsis event was sent to a database via a WI-FI signal. The amount of antiseptic dispensed was determined by the depth to which the dispensing lever was pressed. If the disinfectant lever was pressed several times within two seconds, this was counted as one event with the sum of the several individual doses of disinfectant.
Adherence observations
The adherence observations were based on the five WHO hand disinfection indications [1], [16]. The indications were observed during normal work routine and noted if a hand antisepsis event (HAE) was performed accordingly or not. Observations and documentation were carried out by a highly trained health science student. Based on that list adherence values were calculated [16], [17]. Ten observation periods were conducted on weekdays from 6:30 a.m. to 9:00 a.m. (observation days). The hour from 7:00 a.m. to 8:00 a.m. served as period for the primary endpoint.
Control groups
The observation periods alternated with at least one weekday without observations (non-observation days), which served as Control 1 (same rooms and different days). The observations were limited to two rooms (observation rooms); the two adjacent rooms were used as Control 2 during the observations (different rooms and same days).
In addition, an hourly average value of hand antisepsis events (HAEs) over all 10 observation periods was calculated for the observation group and for the control groups (non-observation times or rooms), which should lead to a graphical comparison.
Sample size calculation
Months before the study started, all of the conventional sanitizers were uninstalled, and 45 WI-FI sanitizer dispensers were installed in the intensive care unit. After a 6-month familiarization period, a one-hour adherence observation from 7:00 a.m. to 8:00 a.m. was conducted. This preliminary observation was used to do a sample size calculation. The Student’s t-test was performed for an independent sample and for a directed and one-sided hypothesis. The case number calculation with an α (significance) level of 0.05 and a power of 0.8 (β=0.2) resulted in n=9 of adherence observation periods each of one hour and the corresponding number of non-observation periods.
Case planning and statistical analysis
The recordings from the adherence observations were compared with those from Control 1 (days without observations) and Control 2 (adjacent rooms), respectively. A Student’s t-test was performed primarily for the period from 7:00 a.m. to 8:00 a.m., when nurses and physicians experienced a high patient workload. Additionally, the entire observation period from 6:30 a.m. to 9:00 a.m. was analyzed. Ten of these observation periods were planned over a five-week study period. The Student’s t-test was performed for an independent sample and for a directed and one-sided hypothesis.
The quantity of the Hawthorne effect was calculated by the difference of WI-FI sanitizer dispenser data during the adherence observations in comparison with the same period on the non-observational days (Control 1).
The primary endpoint of this study was to assess, if adherence observations led to an increase in the number of hand antisepsis events from 7:00 a.m. to 8:00 a.m. A secondary endpoint was, if the amount of sanitizer solution per event increased during the observations. Further secondary endpoints were if an increase in adherence was non-transient and if it could even be seen on days or rooms without direct adherence observations.
Ethical considerations
The study was approved by the Ethics Committee of the Hannover Medical School on February 20, 2024 (688493). No identifiable patient- or staff-related data were collected, stored, or analyzed; all analyses were based on aggregated hand antisepsis event data and room-level occupancy information.
Results
Figure 1 [Fig. 1] shows that there is significant variation in the use of hand sanitizer depending on the time of day. Between 7:00 a.m. and 9:00 a.m., hands were sanitized most frequently, four to five times per patient per hour. In Figure 1A [Fig. 1], before and after the observation period, hands were sanitized at a mean of 1.72 HAEs and a range of 0.37 to 2.40 times per patient per hour, with a minimum during the early morning hours. Based on these data alone, it is not possible to determine whether the increase in events during the observation period was due to the observation itself or to a high workload at that time of day.
Figure 1: Mean number of hand antisepsis events (HAE) per patient per hour Mean hand antisepsis events (HAE) per patient per hour of study group and Control 1 A) in observation rooms on observation days, B) in observation rooms on different days, C) Subtracting the HAEs of Control group 1 (non-observation days and observation rooms) from the HAEs of the study group (observation days and observation rooms), which is the primary endpoint. The difference is statistically significant p<0.01. The mean events are shown as gray columns during the non-observation period and highlighted as green columns during the observation period from 6:30 to 9:00 a.m. The hour from 6:00 to 7:00 a.m. is divided into two half-hour periods - 6:00 to 6:30 is a non-observation period and 6:30 to 7:00 is an observation period.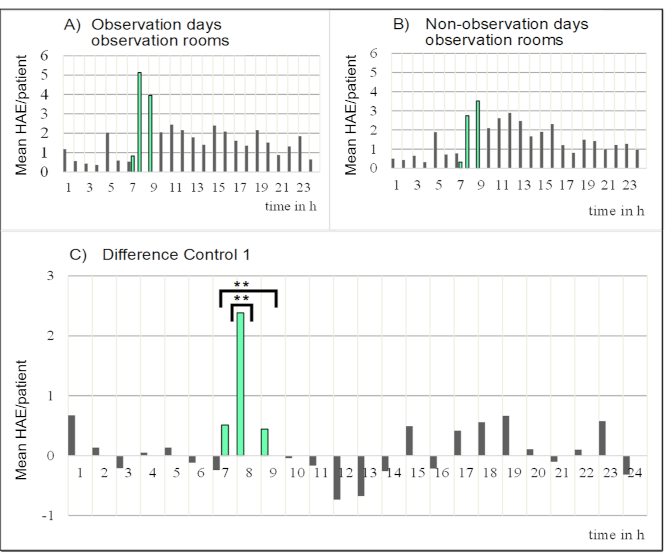
Figure 1C [Fig. 1] shows the difference between Figure 1A [Fig. 1] and Figure 1B [Fig. 1] and can be used to adjust for the bias in the number of hand antisepsis events due to differences in workload during the day. Positive green columns indicate more events during the primary study period, while gray columns indicate the average of the events during non-observation periods. Throughout the entire observation period from 6:30 to 9:00, between 0.44 and 2.38 more events were observed. Immediately after the observation period, however, negative values appeared, indicating that the very recent adherence observations did not result in a sustained increase. Throughout the non-observation periods, the variation ranged from –0.73 to +0.68 HAEs. During the primary observation period from 7:00 a.m. to 8:00 a.m., the mean number of HAEs was 2.56, while the mean for Control 1 (non-observation days) was 1.37. The following results were obtained using Student’s t-test: the t-value was 3.49, and the p-value <0.01. A statistically highly significant result (p<0.01) was also obtained for the entire adherence monitoring period from 6:30 a.m. to 9:00 a.m.
Figure 2 [Fig. 2] shows that there also appears to be some effect, albeit smaller, in the adjacent rooms during the adherence observations. The mean value for Control-2 (non-observational rooms) was 1.55 HAEs, the t-value was 1.52, the p-value was 0.07.
Figure 2: Mean number of hand antisepsis events (HAE) per patient per hour Mean hand antisepsis events (HAE) per patient per hour of Control 2 A) on observation days in non-observation rooms, B) on non-observation days in non-observation rooms. C) Subtracting the HAEs of Control group 2 on non-observation days (non-observation days and non-observation rooms) from the HAEs of Control group 2 on observation days (observation days and non-observation rooms), which is not statistically significant (n.s.). The mean events are shown as gray columns during the non-observation period and highlighted as purple columns during the observation period from 6:30 to 9:00 a.m. The hour from 6:00 to 7:00 a.m. is divided into two half-hour periods - 6:00 to 6:30 is a non-observation period and 6:30 to 7:00 is an observation period.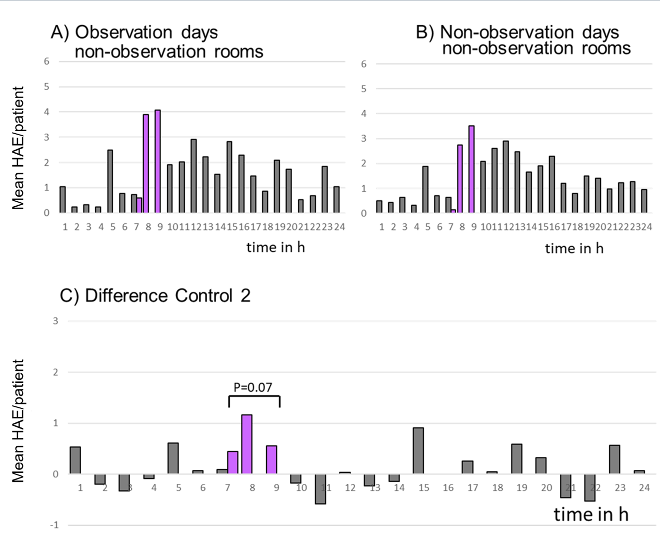
During the adherence observations, an average of 70% of the WHO indications for hand disinfection were followed, with an average of 3.9 hand antisepsis events per patient per hour. The average number of events per patient per hour in Control 1 (non-observational days) was 2.6, which represents a 24% reduction in events. The average number of events per patient per hour in Control 2 (non-observational rooms) was 3.1, which equates to a 16% reduction in events. To adjust the observed adherence rate of 70% to account for the positive influence of the observation, the observed value must be reduced by 24% (+4%), resulting in a theoretical, uninfluenced adherence rate of approximately 53%.
Figure 3 [Fig. 3] illustrates the amount of hand disinfectant solution used per hand antisepsis event (HAE) on observation days (Figure 3A [Fig. 3]), in the same rooms on non-observation days (Figure 3B [Fig. 3]), and the difference between the two (Figure 3C [Fig. 3]). On observation days, during non-observation times (9:00 a.m. to 6:30 a.m.), the consumption varied from 1.82 mL to 4.03 mL, with the lowest consumption occurring in the early morning hours. During observation times (6:30 a.m. to 9:00 a.m.), consumption ranged from 2.50 to 3.31 mL, with a mean of 2.91 mL and a standard deviation of .05 mL.
Figure 3: Mean volume of sanitizer per hand antisepsis event Mean volume of sanitizer per hand antisepsis event (HAE) A) in observation rooms on observation days, B) in observation rooms on different days, C) subtracting the volume of Control group 1 (non-observation days and observation rooms) from the volume of the study group (observation days and observation rooms). The difference is not statistically significant (n.s.). The mean volumes are shown as black columns during the non-observation period and highlighted as yellow columns during the observation period from 6:30 to 9:00 a.m. The hour from 6:00 to 7:00 a.m. is divided into two half-hour periods - 6:00 to 6:30 is a non-observation period and 6:30 to 7:00 is an observation period.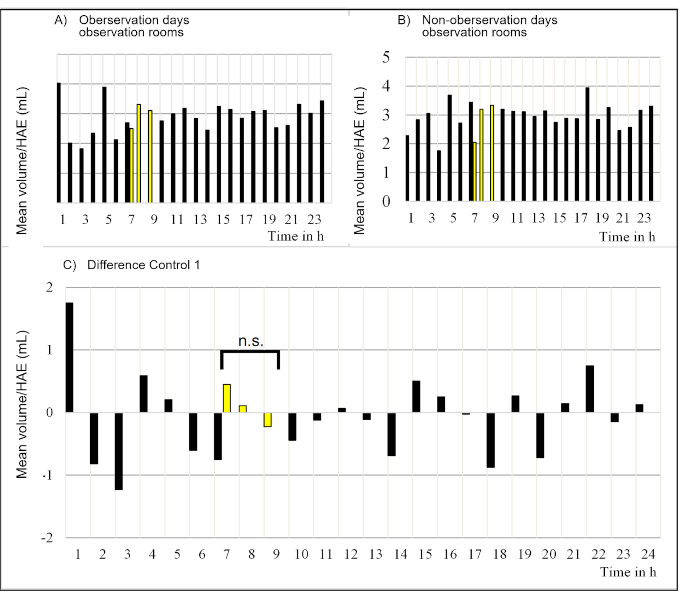
In Figure 3B [Fig. 3], the mean volume during the observation period for Control 1 (same rooms, different days) was 2.81 mL, and the volumes appear quite similar to those in Figure 3A [Fig. 3]. This is also confirmed by the difference between the study group and Control Group 1 (see Figure 3C [Fig. 3]). The hourly differences during the non-observation periods ranged from –1.23 mL to +1.75 mL, and during the observation period, hourly differences ranged from –0.23 mL to +0.45 mL. The Student’s t-test yielded a t-value of 0.59 and a p-value of 0.28.
The mean value for Control Group 2 (different rooms during the adherence observations), whose results are not shown in the graph, was 2.63 mL. Control Group 2 also showed no significant difference from the study group. The t-value was 1.43, the p-value was 0.08.
Discussion
The study had two objectives. First, it aimed to determine if the Hawthorne effect could be measured and quantified using Wi-Fi-enabled hand sanitizer dispensers to establish the true hand sanitization adherence rate. The second objective was to determine if adherence monitoring as part of a multimodal approach is suitable for further improving adherence in a hospital with an established hand antisepsis program.
In preparation for the study, WI-FI hand sanitizer dispensers were installed in optimal locations in the ICU several months in advance. Reminders about hand sanitization were posted, the training program was intensified, and staff received feedback on their sanitization practices. The planned study had to contend with various influencing factors. For example, the number of hand antisepsis events (HAEs) could only be based on a standard patient. In reality, however, patient workloads and indications for hand sanitization varied widely due to different diseases. In addition, hand sanitizer consumption fluctuated over the course of a 24-hour day, depending on the organization or staffing of the shift. These fluctuations are likely explained by the cyclical workflow and the acute, often unpredictable nature of medical and nursing activities.
However, the results of the study showed that only ten observation periods of one hour (or two and a half hours) within five weeks were sufficient to obtain a statistically significant result. Compared to other methods, this approach is the simplest, fastest, and least labor-intensive way to determine the Hawthorne effect [10], [18], [19], [20].
In this study during the observation periods, an average adherence of 70% was observed. With a Hawthorne effect of about –24%, the true unobserved adherence is only 53%. The magnitude of the Hawthorne effect, however, depends on several factors. One is the level of actual unobserved adherence, whether a larger effect is measured at lower or higher levels of unobserved adherence is under discussion [9], [10], [18], [19], [20], [21].
Moreover, as the authority of the participant plays a role in the amplitude of the Hawthorne effect, which is described in previous studies [19], it is shown here that the authority of the observer plays a role too. While adherence observations performed by a trained student in this study showed an adherence of 70%, measurements by a well-known hygiene specialist in our ICU over the years have consistently shown adherence values between 80% and 85%, which means a Hawthorne effect with the same team at the same location can be not only -24% but even more. It is therefore useful to determine the specific Hawthorne effect for individual work areas and conditions.
The Hawthorne effect is not known to be at work long before announced adherence observations begin or after they end [7], [12], [13], [18], [22]. The study presented here can define the time course of the Hawthorne effect without any ambiguous description of transitional periods. There is no transition period as suggested in some publications [12], [18]. Immediately following the adherence monitoring, the initial level is exactly reached again. There is no improvement through adherence monitoring and no “learning” effect as suggested in some publications [9], [12].
Intervention methods to increase the adherence are manifold. Most approaches involve measurement of hand sanitizer use, adherence monitoring, education and feedback [23], [24], [25], [26], [27], [28], [29], [30], [31]. However, the results presented here show that, under the conditions of a long-standing multimodal approach, even when educational support and feedback are further strengthened, professional adherence observations do not increase hand antisepsis. The Hawthorne effect shows that employees knew exactly how to improve their adherence and did exactly that when their actions were observed and documented. If they were not observed, they refrained from those very activities. Even when hand hygiene guidelines are known, they are not necessarily followed. Training is unlikely to help here if the knowledge is already available and is simply not being applied. The immediate drop in adherence back to baseline levels after the observation period indicates in addition that monitoring itself did not result in a learning effect.
The findings of this study highlight a critical limitation of current hand antisepsis improvement strategies. Despite years of implementation, traditional interventions do not appear to increase adherence to a sufficient extent. Instead, they may contribute to inflated adherence figures that overestimate actual practice and provide a misleading basis for quality reporting. This result confirms the conclusion of a study by Zwicker et al. [5]. The authors therefore consider short-term interventions, such as adherence monitoring, to be generally unsuitable for achieving a lasting effect and advocate for continuous monitoring with feedback. It is hoped that new technologies using visual or auditory cues or feedback can deliver this and will improve adherence in the future. However, there is currently no convincing data on the long-term benefits or effects on infection rates. With camera-assisted or sensor-assisted observation and real-time locating systems, adherence information could be tailored more precisely to the individual. However, issues such as privacy and data protection still need to be addressed [4], [32].
It could be considered good news that the amount of disinfectant used per hand antisepsis event (HAE) was not subject to the Hawthorne effect, or at least significantly less so. In any case, the amounts used were in line with the 3 ml recommended by the World Health Organization. Getting used to press the sanitizer dispenser about two or three times per event, which takes no more than one second total, obviously means no additional workload for staff working under time pressure. Once you have figured out how to get the right amount it can be done almost unconsciously.
Limitations
The extent to which our results are generalizable is unknown, because the study was limited to the ICU of a single hospital and the adherence observations only to a short period of 6 weeks in the morning shift. Results cannot be transferred between different work shifts [31].
The analyses did not differentiate between different diseases or the infectious status of the patients. Differentiated studies would provide additional insights.
Hand sanitizer is also used by visitors who mainly come to the ward in the afternoon. However, our adherence observations and hand sanitizer consumption figures were only statistically evaluated in the period from 6:30 a.m. to 9:00 a.m.
The results presented here cast doubt on the success of educational interventions, but this does not necessarily apply to particularly good individual educational concepts. Further studies using the method presented here are conceivable and could be used for comparative evaluation of educational interventions.
Conclusions
By combining Wi-Fi-enabled hand sanitizer dispensers with direct adherence observations, this study was able to quantify the Hawthorne effect in hand hygiene behaviour and to determine its onset, duration, and magnitude. Observed adherence clearly exceeded unobserved routine behaviour, revealing actual hand hygiene adherence rates that must be considered clinically unacceptable.
The findings further show that, in a hospital with a long-standing institutional focus on infection prevention, a multimodal hand hygiene strategy—including optimally placed dispensers, staff training, reminder posters, adherence observations, and feedback—did not achieve a further sustained increase in adherence. Conventional adherence-enhancing measures therefore appear insufficient to close the gap between observed and actual hand hygiene behaviour. New strategies are urgently needed to improve hand hygiene adherence reliably and sustainably.
Notes
Author’s ORCID
Ethical approval
The study was approved by the Ethics Committee of the Hannover Medical School on February 20, 2024 (688493).
Funding
None.
AI usage
AI-assisted technology was used solely for language editing and improvement of readability. The authors reviewed and approved all content and take full responsibility for the final manuscript.
Data availability
The datasets used and/or analysed during the current study are available from the corresponding author on reasonable request.
Competing interests
The authors declare that they have no competing interests.
References
[1] World Health Organization. Clean Care is Safer Care Team. WHO Guidelines on Hand Hygiene in Health Care: First Global Patient Safety Challenge Clean Care Is Safer Care. Geneva: World Health Organization; 2009. Available from: http://www.ncbi.nlm.nih.gov/books/NBK144013/[2] Händehygiene in Einrichtungen des Gesundheitswesens : Empfehlung der Kommission für Krankenhaushygiene und Infektionsprävention (KRINKO) beim Robert Koch-Institut (RKI). Bundesgesundheitsblatt Gesundheitsforschung Gesundheitsschutz. 2016 Sep;59(9):1189-220. German. DOI: 10.1007/s00103-016-2416-6
[3] Boyce JM. Electronic monitoring in combination with direct observation as a means to significantly improve hand hygiene compliance. Am J Infect Control. 2017 May;45(5):528–35. DOI: 10.1016/j.ajic.2016.11.029
[4] Wang C, Jiang W, Yang K, Yu D, Newn J, Sarsenbayeva Z, et al. Electronic Monitoring Systems for Hand Hygiene: Systematic Review of Technology. J Med Internet Res. 2021 Nov 24;23(11):e27880. DOI: 10.2196/27880
[5] Zwicker P, Meng M, Friesecke S, Stein T, Herzog A, Herzer C, Kammerlander M, Gebhardt T, Kugler C, Kramer A. An interactive feedback system for increasing hand antisepsis adherence in stationary intensive care. J Hosp Infect. 2023 Mar;133:73-80. DOI: 10.1016/j.jhin.2022.12.017
[6] Venkatesh AK, Lankford MG, Rooney DM, Blachford T, Watts CM, Noskin GA. Use of electronic alerts to enhance hand hygiene compliance and decrease transmission of vancomycin-resistant Enterococcus in a hematology unit. Am J Infect Control. 2008 Apr;36(3):199-205. DOI: 10.1016/j.ajic.2007.11.005
[7] Srigley JA, Furness CD, Baker GR, Gardam M. Quantification of the Hawthorne effect in hand hygiene compliance monitoring using an electronic monitoring system: a retrospective cohort study. BMJ Qual Saf. 2014 Dec;23(12):974-80. DOI: 10.1136/bmjqs-2014-003080
[8] Haessler S. The Hawthorne effect in measurements of hand hygiene compliance: a definite problem, but also an opportunity. BMJ Qual Saf. 2014 Dec;23(12):965-7. DOI: 10.1136/bmjqs-2014-003507
[9] Eckmanns T, Bessert J, Behnke M, Gastmeier P, Ruden H. Compliance with antiseptic hand rub use in intensive care units: the Hawthorne effect. Infect Control Hosp Epidemiol. 2006 Sep;27(9):931-4. DOI: 10.1086/507294
[10] Hagel S, Reischke J, Kesselmeier M, Winning J, Gastmeier P, Brunkhorst FM, Scherag A, Pletz MW. Quantifying the Hawthorne Effect in Hand Hygiene Compliance Through Comparing Direct Observation With Automated Hand Hygiene Monitoring. Infect Control Hosp Epidemiol. 2015 Aug;36(8):957-62. DOI: 10.1017/ice.2015.93
[11] Mayo E. The Human Problems of an Industrial Civilization. 1st ed. London: Routledge; 2003. DOI: 10.4324/9780203487273
[12] Chen LF, Vander Weg MW, Hofmann DA, Reisinger HS. The Hawthorne Effect in Infection Prevention and Epidemiology. Infect Control Hosp Epidemiol. 2015 Dec;36(12):1444-50. DOI: 10.1017/ice.2015.216
[13] Pittet D. Improving compliance with hand hygiene in hospitals. Infect Control Hosp Epidemiol. 2000 Jun;21(6):381-6. DOI: 10.1086/501777
[14] Ward MA, Schweizer ML, Polgreen PM, Gupta K, Reisinger HS, Perencevich EN. Automated and electronically assisted hand hygiene monitoring systems: a systematic review. Am J Infect Control. 2014 May;42(5):472-8. DOI: 10.1016/j.ajic.2014.01.002
[15] Scheithauer S, Bickenbach J, Heisel H, Fehling P, Marx G, Lemmen S. Do WiFi-based hand hygiene dispenser systems increase hand hygiene compliance? Am J Infect Control. 2018 Oct;46(10):1192-1194. DOI: 10.1016/j.ajic.2018.03.026
[16] Haas JP, Larson EL. Measurement of compliance with hand hygiene. J Hosp Infect. 2007 May;66(1):6-14. DOI: 10.1016/j.jhin.2006.11.013
[17] Erasmus V, Daha TJ, Brug H, Richardus JH, Behrendt MD, Vos MC, van Beeck EF. Systematic review of studies on compliance with hand hygiene guidelines in hospital care. Infect Control Hosp Epidemiol. 2010 Mar;31(3):283-94. DOI: 10.1086/650451
[18] Vaisman A, Bannerman G, Matelski J, Tinckam K, Hota SS. Out of sight, out of mind: a prospective observational study to estimate the duration of the Hawthorne effect on hand hygiene events. BMJ Qual Saf. 2020 Nov;29(11):932-938. DOI: 10.1136/bmjqs-2019-010310
[19] Wu KS, Lee SSJ, Chen JK, Chen YS, Tsai HC, Chen YJ, Huang YH, Lin HS. Identifying heterogeneity in the Hawthorne effect on hand hygiene observation: a cohort study of overtly and covertly observed results. BMC Infect Dis. 2018 Aug 6;18(1):369. DOI: 10.1186/s12879-018-3292-5
[20] El-Saed A, Noushad S, Tannous E, Abdirizak F, Arabi Y, Al Azzam S, Albanyan E, Al Jahdalil H, Al Sudairy R, Balkhy HH. Quantifying the Hawthorne effect using overt and covert observation of hand hygiene at a tertiary care hospital in Saudi Arabia. Am J Infect Control. 2018 Aug;46(8):930-935. DOI: 10.1016/j.ajic.2018.02.025
[21] Kohli E, Ptak J, Smith R, Taylor E, Talbot EA, Kirkland KB. Variability in the Hawthorne effect with regard to hand hygiene performance in high- and low-performing inpatient care units. Infect Control Hosp Epidemiol. 2009 Mar;30(3):222-5. DOI: 10.1086/595692
[22] Kwok YLA, Juergens CP, McLaws ML. Automated hand hygiene auditing with and without an intervention. Am J Infect Control. 2016 Dec 1;44(12):1475-1480. DOI: 10.1016/j.ajic.2016.08.014
[23] Yoo E, Ursua L, Clark R, Seok J, Jeon J, Kim HB. The effect of incorporating covert observation into established overt observation-based hand hygiene promotion programs. Am J Infect Control. 2019 May;47(5):482-486. DOI: 10.1016/j.ajic.2018.11.002
[24] Kirkland KB, Homa KA, Lasky RA, Ptak JA, Taylor EA, Splaine ME. Impact of a hospital-wide hand hygiene initiative on healthcare-associated infections: results of an interrupted time series. BMJ Qual Saf. 2012 Dec;21(12):1019-26. DOI: 10.1136/bmjqs-2012-000800
[25] Dubbert PM, Dolce J, Richter W, Miller M, Chapman SW. Increasing ICU staff handwashing: effects of education and group feedback. Infect Control Hosp Epidemiol. 1990 Apr;11(4):191-3. DOI: 10.1086/646148
[26] Davis CR. Infection-free surgery: how to improve hand-hygiene compliance and eradicate methicillin-resistant Staphylococcus aureus from surgical wards. Ann R Coll Surg Engl. 2010 May;92(4):316-9. DOI: 10.1308/003588410X12628812459931
[27] Day C. Engaging the nursing workforce: an evidence-based tool kit. Nurs Adm Q. 2009 Jul-Sep;33(3):239-44. DOI: 10.1097/NAQ.0b013e3181accb31
[28] Huis A, Schoonhoven L, Grol R, Donders R, Hulscher M, van Achterberg T. Impact of a team and leaders-directed strategy to improve nurses' adherence to hand hygiene guidelines: a cluster randomised trial. Int J Nurs Stud. 2013 Apr;50(4):464-74. DOI: 10.1016/j.ijnurstu.2012.08.004
[29] Scheithauer S, Lemmen SW. How can compliance with hand hygiene be improved in specialized areas of a university hospital? J Hosp Infect. 2013 Feb;83 Suppl 1:S17-22. DOI: 10.1016/S0195-6701(13)60005-5
[30] Allegranzi B, Gayet-Ageron A, Damani N, Bengaly L, McLaws ML, Moro ML, Memish Z, Urroz O, Richet H, Storr J, Donaldson L, Pittet D. Global implementation of WHO's multimodal strategy for improvement of hand hygiene: a quasi-experimental study. Lancet Infect Dis. 2013 Oct;13(10):843-51. DOI: 10.1016/S1473-3099(13)70163-4
[31] Pittet D, Hugonnet S, Harbarth S, Mourouga P, Sauvan V, Touveneau S, Perneger TV. Effectiveness of a hospital-wide programme to improve compliance with hand hygiene. Infection Control Programme. Lancet. 2000 Oct 14;356(9238):1307-12. DOI: 10.1016/s0140-6736(00)02814-2
[32] Gould D, Hawker C, Drey N, Purssell E. Should automated electronic hand-hygiene monitoring systems be implemented in routine patient care? Systematic review and appraisal with Medical Research Council Framework for Complex Interventions. J Hosp Infect. 2024 May;147:180-187. DOI: 10.1016/j.jhin.2024.03.012