[Prädiktion des Sprachverstehens mit Hörgerät mittels Random Forest Regression]
Max Engler 1Frank Digeser 1
Ulrich Hoppe 1
1 Department of Audiology, ENT Clinic, University of Erlangen-Nürnberg, Erlangen, Germany
Zusammenfassung
Menschen mit Hörgeräten (HGs) zeigen eine bislang weitgehend unerklärte Variabilität im Sprachverstehen mit HG. Bisher gibt es keine klare Empfehlung zur Bewertung der HG-Versorgung, insbesondere im Hinblick auf das erreichbare Sprachverstehen mit HG. Ziel dieser Studie war es, die einflussreichsten Faktoren auf das Sprachverstehen mit HG bei einem Schalldruckpegel von 65 dB SPL (Sound Pressure Level) zu identifizieren; im Folgenden als WRS65(HA) bezeichnet. Retrospektiv wurden Daten aus klinischen Routinemessungen von 635 Hörgeräteträgern analysiert, wobei 18 demografische, audiologische und hörgerätespezifische Merkmale berücksichtigt wurden. Zur Vorhersage von WRS65(HA) wurde ein Random Forest Regressionsmodell (RFR) eingesetzt. Durch ein iteratives Merkmals-Auswahlverfahren wurde die Kombination von Merkmalen mit dem geringsten mittleren absoluten Fehler (MAE) ermittelt. Audiologische Merkmale wie das maximale Einsilberverstehen (WRSmax), der mittlere Hörverlust (PTA) und das unversorgte Einsilberverstehen bei 65 dB SPL (WRS65) wiesen die höchste individuelle Vorhersagegenauigkeit auf. Demografische Merkmale wie Alter und Geschlecht schnitten deutlich schlechter ab. Der niedrigste signifikante MAE (9,8 Prozentpunkte, pp) wurde mit einer Drei-Merkmals-Kombination erreicht: WRSmax, WRS65 und die Ziel-Abweichungen bei in-situ-Messungen im mittleren Frequenzbereich bei 65 dB SPL. Die Einbeziehung zusätzlicher Funktionen scheint nur einen begrenzten Nutzen zu bringen und kann das Risiko einer Überanpassung erhöhen. Das einfache, PTA-basierte Vorhersagemodell von Hoppe et al. (2014) erreichte einen MAE von 14,4 pp und wurde durch die ermittelte Drei-Merkmals-Kombination um 4,6 pp übertroffen. Die Ergebnisse zeigen, dass PTA allein nicht ausreicht, um WRS65(HA) zuverlässig vorherzusagen. Eine Kombination aus audiologischen und HG-spezifischen Parametern lieferte deutlich bessere Ergebnisse.
Schlüsselwörter
Hörgerät, In-situ-Messungen, maschinelles Lernen
Introduction
Speech recognition improvement through hearing aids (HAs) is a key indicator of successful hearing rehabilitation and remains a central objective in audiological care. Effective HA fitting requires a delicate balance between providing sufficient amplification and maintaining user comfort and speech clarity. In clinical practice, the word recognition score at 65 dB sound pressure level (SPL) is commonly evaluated using standardised speech tests, such as the Freiburg monosyllable test [1], and is referred to hereinafter as WRS65(HA). Despite certain limitations, it remains the most commonly used tool for evaluating HA benefit in German-speaking countries and is endorsed in the German health-care [2].
Nevertheless, considerable individual variability in speech recognition persists, even among patients with similar hearing loss [3], [4], [5], [6], [7], [8], [9]. According to Hoppe et al. (2014), the greatest variability in WRS65(HA), ranging from 0% to 95%, was observed around a pure-tone average (PTA) of 60 dB hearing level [3]. Holube and Kollmeier (1996) demonstrated that speech recognition in HA users depends not only on audiometric thresholds but also on auditory processing factors such as temporal and spectral resolution [10]. These factors are described as the “distortion” component in Plomp’s model (1986) [11]. While Holube et al. (1996) and Plomp (1986) emphasize speech recognition in noise, where processing deficits have a greater impact and performance is more strongly influenced by auditory processing abilities (‘distortion’ [11]), the studies by other authors (e.g., [3], [4], [5], [6], [7], [8], [9]) primarily focus on speech recognition in quiet, which is largely determined by audibility (‘attenuation’ [11]). Although many studies have developed predictive models for speech recognition in noise, relatively few focus on speech recognition in quiet while integrating multiple influencing factors. These findings underscore the need for predictive models that extend beyond pure measures of hearing loss. Such models could also support clinical practice by enabling faster detection and interpretation of individual results in speech recognition.
Machine learning methods like Random Forest Regression (RFR [12]) are well-suited for modelling complex and nonlinear relationships between input features. RFR is an ensemble-based algorithm that combines multiple decision tree regressors to predict continuous outcomes. In contrast to so-called “black box” models, such as deep neural networks, which offer limited insight into the underlying decision process, RFR provides access to feature importance metrics and decision pathways. These aspects are crucial for fostering trust, transparency, and practical applicability in healthcare settings.
In this retrospective study, data from routine clinical assessments, including audiometric, demographic, and HA-related parameters, were utilised to develop a predictive model of WRS65(HA) based on RFR. The primary objective was to identify the most influential predictors of WRS65(HA) using a forward feature selection process [13], and to investigate the added value of combining features across different domains. This data-driven approach enhances understanding of the factors affecting HA performance, supporting more individualised and evidence-based HA fitting in clinical practice.
Methods
Clinical routine data were collected retrospectively, encompassing a broad range of variables such as demographic information, audiological measures, and HA-related parameters. These variables underwent a feature selection process to identify those with the greatest impact on WRS65(HA).
Data preparation
In this study, 635 HA evaluations of 374 patients (166 f, 208 m), comprising 303 bilateral and 71 unilateral HA users, aged 20–96 years (mean and standard deviation: 66.6±15.0 years) were analysed. Demographic details are given in [9]. For pure-tone and speech audiometry, a standard clinical audiometer (AT900/AT1000 Auritec, Hamburg, Germany) was used. The four-frequency PTA, hereinafter referred to as PTA, was measured separately for both ears. For each speech recognition measurement, one list of 20 words of the Freiburg monosyllable test [1] was presented. The maximum word recognition score (WRSmax) was measured via headphones by stepwise increasing the presentation level, starting at 65 dB SPL. The level at which WRSmax was reached is referred to as L(WRSmax). Aided (WRS65(HA)) and unaided (WRS65) speech recognition were determined in quiet at 65 dB SPL in sound field, using a loudspeaker placed in front (0°, 1 m). Additionally, the HA manufacturer and the HA experience in years were documented.
In order to evaluate the fitting quality of the HA, the sound-pressure level in the aided ear was measured by real-ear measurements with the Aurical II (Aurical, Natus, Münster, Germany). The international speech test signal (ISTS [14]) was presented at 50, 65 and 80 dB SPL to determine the long-term average speech spectrum (LTASS [15]) for 20 third-octave frequency bands fn (fn=0.125*2((n–1)/3) kHz, n=1, 2, …, 20), based on established LTASS characteristics. The corresponding target levels were derived according to the DSL v5.0 (Desired Sensation Level version 5.0) prescription rule [16], [17]. To quantify the match between prescribed and measured output, the mean difference between LTASS and targets was calculated and referred to as the fit-to-target value (FtT). These FtT values were analysed across three frequency ranges — Low (0.25–0.63 kHz), Mid (0.8–2.5 kHz), and High (3.15–6 kHz) — and for each of the three input levels (50, 65, and 80 dB SPL). This resulted in nine distinct features: FtT50(Low), FtT50(Mid), FtT50(High), FtT65(Low), FtT65(Mid), FtT65(High), FtT80(Low), FtT80(Mid), and FtT80(High), which together represent the accuracy of HA fitting across the speech spectrum and varying input levels.
Model setup
Random forest models are widely used for classification, regression, and predictive modelling due to their robustness and ability to handle high-dimensional data. In this study, the predictive performance of an RFR was evaluated using 18 features (see Figure 1 [Fig. 1]), following an iterative forward feature selection process [13] based on mean absolute error (MAE):

where n is the number of data points,  represents the measured value and
  denotes the predicted value of speech recognition using the Freiburg monosyllable test, and |
 –
– | is the absolute error for the i-th data point.
Figure 1: Mean absolute error (MAE) for 18 features, sorted by their MAE (highest to lowest). Each feature was individually fed into a Random Forest Regression and evaluated 100 times. 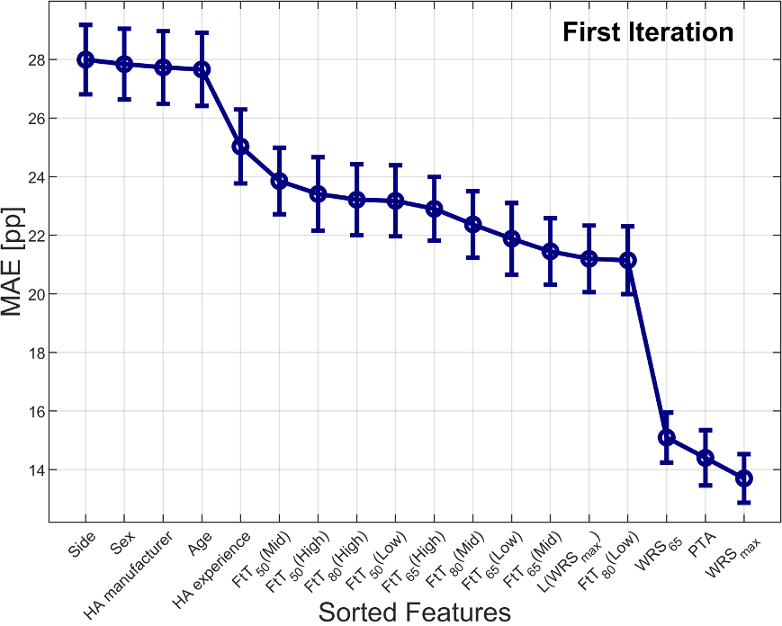
For each iteration of the RFR model, the dataset was randomly split into 80% training and 20% test data. The selected features were evaluated over 100 independent runs to account for variability in random sampling, and the resulting MAE represents the average across these runs. Initially, each of the 18 features was tested individually and ranked based on their average MAE (see Figure 1 [Fig. 1]). The best-performing feature (lowest MAE) was selected for the second iteration. In the next step, this top-ranked feature was combined with each of the remaining 17 features to identify the optimal two-feature combination (see Figure 2 [Fig. 2]), again based on the lowest MAE. This greedy forward-selection approach was repeated iteratively, adding one feature at a time based on performance, until all features were ranked. The optimal feature subset was identified at the iteration step with the minimum MAE. Additionally, statistical significance tests were used to determine the point up to which the MAE continued to decrease significantly. This step was considered the best balance between model complexity and predictive performance. For the entire feature selection process, we used fixed standard hyperparameters:
- Forest size (number of trees)=100
- Min leaf size (minimum number of data points required in a leaf node)=5
- Max splits (maximum number of splits allowed in any decision tree)=25
Figure 2: Mean absolute error (MAE) across 18 iterations. Each iteration illustrates the lowest MAE by using the selected feature with the previous ones. The red rectangle highlights the iteration that led to the overall lowest MAE (MAEmin). The blue rectangle marks the iteration where the reduction in MAE was still statistically significant compared to the previous iteration (MAEsig). (*** p<0.001, Iteration 1/2; *** p<0.001, Iteration 2/3)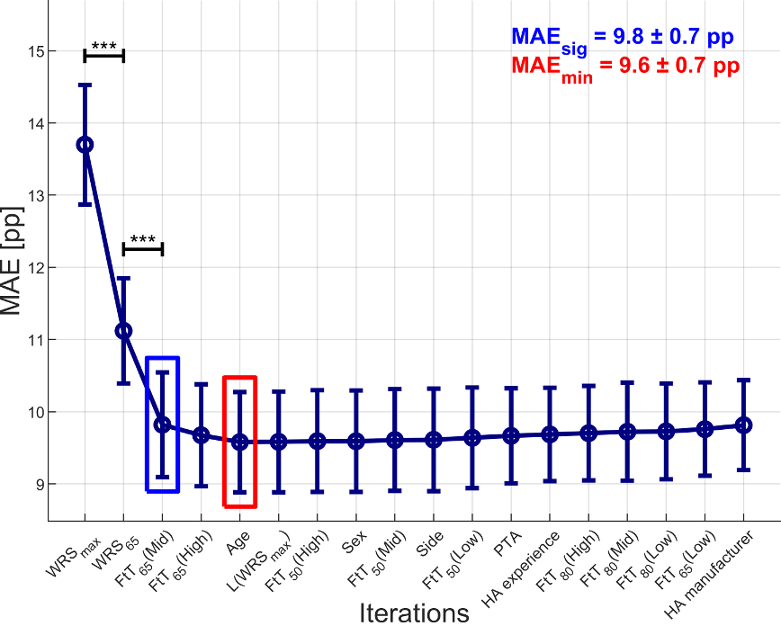
Fixed hyperparameters were chosen to ensure that differences in model performance could be attributed to feature selection rather than changes in model complexity. While hyperparameter optimization is known to potentially improve model performance, the focus here was on evaluating feature importance under consistent model settings. Performing hyperparameter optimization initially with the full feature set could bias the feature selection process, as optimal settings for a large feature set may not generalize well to smaller subsets. Furthermore, conducting hyperparameter tuning at every iteration of the feature selection process would drastically increase the total computational time, with likely only marginal improvements in performance.
Data analysis
The dataset was complete and contained no missing or erroneous values, so no data cleaning was required. The Shapiro–Wilk test was conducted to assess the normality of the data. Based on the results, either t-tests or rank-sum tests were applied for pairwise comparisons, using a significance level of α=0.05. Spearman’s method was used to calculate correlations. The statistical tests were carried out with Statistical Package for Social Sciences (SPSS® V24, IBM Corp., Armonk/NY, USA) and the RFR was performed with Matlab® R2020b (Mathworks, Natick/MA, USA).
Results
Figure 1 [Fig. 1] presents the MAE as a result of the RFR for each feature used individually as an input parameter. The features are ranked in descending order of MAE, starting with the highest (worst) and ending with the lowest (best). Side, sex, HA manufacturer, and age yielded the highest MAEs (27.7–28 percentage points, pp). Including HA-experience reduced the MAE to 25 pp, with further reductions down to 21.1 pp across the FtT-values and L(WRSmax). Among all features, the largest MAE reduction was found between FtT80(Low) and WRS65, where the MAE dropped from 21.1 pp to 15.1 pp. Ultimately, PTA emerged as the second-best feature (14.4 pp), while WRSmax achieved the lowest MAE (13.7 pp) in the first iteration, making it the best-performing feature.
In Figure 2 [Fig. 2], each iteration represents a stepwise feature selection process, starting with the single best-performing feature WRSmax with the lowest MAE of 13.7 pp from the first iteration (see Figure 1 [Fig. 1]). Iteration 2 shows the MAE of the best combination of two features: the best feature from Iteration 1 paired with the remaining feature that resulted in the largest additional performance gain (WRSmax and WRS65). This process continues iteratively, where each step selects the feature that, when combined with the previously chosen set, yields the lowest MAE. The MAE reaches its lowest point with the optimal feature set in the fifth iteration, including WRSmax, WRS65, FtT65(Mid), FtT65(High) and age, yielding an MAE (MAEmin) of 9.6 pp with a standard deviation of ±0.7 pp. Beyond this point, adding more features provided no further improvements and might have even slightly increased the MAE. Finally, t-tests or rank-sum tests with Bonferroni correction were conducted to determine up to which iteration the MAE continued to decrease significantly. The last iteration showing a significant improvement in MAE was defined as the best trade-off between model complexity and predictive accuracy, which occurred in the third iteration including WRSmax, WRS65 and FtT65(Mid) (MAEsig=9.8±0.7 pp).
The predicted WRS65(HA) is plotted against the measured WRS65(HA) in Figure 3 [Fig. 3] for a randomly selected subset of test data from the third iteration, which represents the significantly best-performing feature combination. The correlation analysis revealed a strong correlation (r=0.93, α=0.001), indicating a high degree of alignment between the model's predictions and the actual measured scores.
Figure 3: Scatter plot and correlation analysis between measured and predicted speech recognition with hearing aid (WRS65(HA)) for a randomly selected subset of test data from the third iteration (n=127, 20% test data) 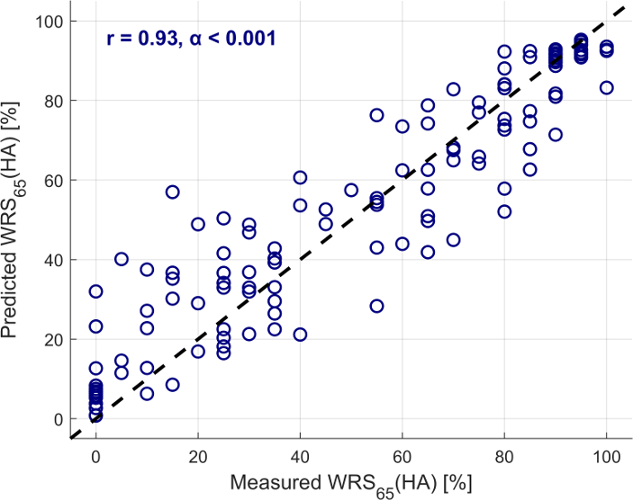
Discussion and conclusion
Demographic, audiological, and HA-related data from a large cohort of HA users were analysed to identify key factors influencing aided speech recognition. A Random Forest Regression with iterative feature selection was applied to determine the most predictive features.
When used as individual input features for the RFR, demographic data such as sex, side, and age, as well as HA manufacturer resulted in the poorest performance, with an MAE of approximately 28 pp (see Figure 1 [Fig. 1]). For reference, a MAE of  pp corresponds to completely random predictions, for example, when both measured (
 ) and predicted (
 ) values are uniformly distributed from 0 to 100. To improve the interpretability of these features, an auxiliary analysis was performed for each of the four features: the original values were replaced with random samples drawn from the same empirical distribution (i.e., probability density function, PDF) as the respective feature. Assuming statistical independence between
  and
and  , the resulting MAEs were again close to 28 pp. This suggests that the observed performance likely reflects a statistical lower bound rather than meaningful predictive power.
However, the authors were surprised that age did not emerge as a more significant factor and leads to similarly poor performance as the categorical features such as sex, side, and HA manufacturer. This finding contrasts with previous studies suggesting that age influences WRS65(HA), with HA users aged 70 and older demonstrating significantly poorer outcomes compared to younger users [3], [4]. On the other hand, Kronlachner et al. (2018) reported no significant effect of age on WRS65(HA) among a cohort of seniors aged 65 to 88 years [5]. While HA manufacturer was more similar to the demographic data, other HA-related features such as HA experience, and the nine fit-to-target values showed a continuous improvement in MAE (25–21.1 pp). The analysis of the audiological features yielded the best performance, with WRS65 (15.1 pp), PTA (14.3 pp) and WRSmax (13.7 pp) achieving nearly half the MAE compared to the demographic features.
In comparison, the generalised formula proposed by Hoppe et al. (2014) offers a simple predictive approach based solely on PTA measurements. This formula, derived using logistic regression, was applied to our dataset (n=635) and yielded an MAE of 14.4 pp [3]. This result demonstrates that, despite the simplicity of the formula, it achieves a prediction accuracy comparable to our audiologic feature-based model and closely matches the MAE observed when using only PTA as the input feature for the RFR in this study.
In order to reduce the MAE even further, the best-performing feature of the first iteration was combined with all of the remaining ones, to evaluate the best-performing two-feature combination. Subsequently, the best-performing three-feature combination was evaluated, and this process repeated iteratively until a feature combination yielding the lowest MAE across all 18 iterations was identified (see Figure 2 [Fig. 2]). The minimum MAE (MAEmin=9.6 pp) occurred in the fifth iteration and included WRSmax, WRS65, FtT65(Mid), FtT65(High) and age.
The statistical analysis revealed a statistically significant improvement in MAE compared to the previous iteration only up to the third iteration (MAEsig=9.8 pp), which excluded FtT65(High) and age. In general, including more than five features did not lead to further improvements in performance and even caused a slight decline due to potential overfitting. However, fine-tuning the hyperparameters in each iteration could still enhance the performance of the RFR, but it would significantly increase the computational effort. Notably, the three-feature combination from the third iteration resulted in a 4.6 pp improvement over the model reported by Hoppe et al. (2014), which only used PTA as an input feature [3]. Despite PTA being the second-best single-performing feature, it showed no significant influence on WRS65(HA) when combined with other features. A possible explanation for this could be the high correlation between PTA and both WRSmax and WRS65, as reported in previous studies [3], [4], [5], [6], [7], [8], [9]. Consequently, much of the information provided by PTA may already be accounted for by WRSmax and WRS65.
For the fit-to-target values, only those at 65 dB SPL input level in the mid and high-frequency ranges showed an influence on WRS65(HA). Digeser et al. (2020) highlighted that adequate amplification in these frequency ranges is crucial for speech recognition, particularly for high-frequency speech cues [18]. To derive these fit-to-target values, the mean differences between LTASS and prescriptive target values of DSL v5.0 were used. While alternative targets could be considered, a recently published study demonstrated that, with a focus on 65 dB SPL input levels, HA users with a close match to the DSL-v5.0-targets exhibited consistently good speech recognition across all degrees of hearing loss [9].
This study demonstrated that parameters from audiometry, particularly WRSmax and WRS65, are the most influential predictors of WRS65(HA). While HA-related features such as fitting accuracy in the 0.8–2.5 kHz frequency range at 65 dB SPL input level performed poorly on their own, their combination with audiological features significantly improved model accuracy. This underscores not only the relevance of feature interactions, but also the important role of optimal HA fitting in achieving successful HA outcomes.
Limitations of the study
Unfortunately, the influence of fit-to-target accuracy for low and high input levels was not examined. However, the results in this study suggested that the fit-to-target values for these low and high input levels did not influence WRS65(HA), likely due to redundancy with the fit-to-target values established for 65 dB SPL input level. Furthermore, many of the features used in this RFR are likely strongly correlated, leading to a certain degree of redundancy within the overall feature set. A detailed correlation analysis was not performed in this study.
Principal Component Analysis (PCA) was not applied in this study, as the number of features was limited and model interpretability was prioritised. However, future work may include PCA or other dimensionality reduction techniques to evaluate their effect on model performance.
Notes
Cumulative dissertation
The present work was performed in partial fulfillment of the requirements for obtaining the degree “Dr. rer. biol. hum.” at the Friedrich-Alexander-Universität Erlangen-Nürnberg (FAU).
Conference presentation
This contribution was presented at the 27th Annual Conference of the German Society of Audiology and published as an abstract [19].
Data availability
Raw data supporting the findings of this study are available from the corresponding author upon reasonable request.
Funding
This work was supported by Cochlear Research and Development Ltd [IIR-2398].
Competing interests
The authors declare that they have no competing interests.
References
[1] Hahlbrock KH. Sprachaudiometrie: Grundlagen und Praktische Anwendung einer Sprachaudiometrie für das Deutsche Sprachgebiet. Stuttgart: Thieme; 1957.[2] Gemeinsamer Bundesausschuss. Richtlinie des Gemeinsamen Bundesausschusses über die Verordnung von Hilfsmitteln in der vertragsärztlichen Versorgung (Hilfsmittel-Richtlinie / HilfsM-RL) in der Neufassung vom 01.04.2021. BAnz AT 15.04.2021 B3. Berlin: Gemeinsamer Bundesausschuss.
[3] Hoppe U, Hast A, Hocke T. Sprachverstehen mit Hörgeräten in Abhängigkeit vom Tongehör [Speech perception with hearing aids in comparison to pure-tone hearing loss]. HNO. 2014 Jun;62(6):443-8. DOI: 10.1007/s00106-013-2813-1
[4] Müller A, Hocke T, Hoppe U, Mir-Salim P. Der Einfluss des Alters bei der Evaluierung des funktionellen Hörgerätenutzens mittels Sprachaudiometrie [The age effect in evaluation of hearing aid benefits by speech audiometry]. HNO. 2016 Mar;64(3):143-8. DOI: 10.1007/s00106-015-0115-5
[5] Kronlachner M, Baumann U, Stöver T, Weißgerber T. Untersuchung der Qualität der Hörgeräteversorgung bei Senioren unter Berücksichtigung kognitiver Einflussfaktoren [Investigation of the quality of hearing aid provision in seniors considering cognitive functions]. Laryngorhinootologie. 2018 Dec;97(12):852-9. DOI: 10.1055/a-0671-2295
[6] Dörfler C, Hocke T, Hast A, Hoppe U. Sprachverstehen mit Hörgeräten für 10 Standardaudiogramme [Speech recognition with hearing aids for 10 standard audiograms: English version]. HNO. 2020 Aug;68(Suppl 2):93-9. DOI: 10.1007/s00106-020-00843-y
[7] Engler M, Digeser F, Hoppe U. Wirksamkeit der Hörgeräteversorgung bei hochgradigem Hörverlust [Effectiveness of hearing aid provision for severe hearing loss]. HNO. 2022 Jul;70(7):520-32. DOI: 10.1007/s00106-021-01139-5
[8] Hoppe U, Hast A, Hocke T. Disproportional hoher Verlust an Sprachverstehen [Disproportionately high loss in speech intelligibility]. HNO. 2024 Dec;72(12):885-92. DOI: 10.1007/s00106-024-01518-8
[9] Engler M, Digeser F, Hoppe U. Speech recognition and real-ear-measured amplification in hearing-aid users with various grades of hearing loss. Int J Audiol. 2024 Dec;63:1-12. DOI: 10.1080/14992027.2024.2426009
[10] Holube I, Kollmeier B. Speech intelligibility prediction in hearing-impaired listeners based on a psychoacoustically motivated perception model. J Acoust Soc Am. 1996 Sep;100(3):1703-16. DOI: 10.1121/1.417354
[11] Plomp R. A signal-to-noise ratio model for the speech-reception threshold of the hearing impaired. J Speech Hear Res. 1986 Jun;29(2):146-54. DOI: 10.1044/jshr.2902.146
[12] Breiman L. Random Forests. Machine Learning. 2001;45:5-32. DOI: 10.1023/A:1010933404324
[13] Pudil P, Novovičová J, Kittler J. Floating search methods in feature selection. Pattern Recognit Lett. 1994;15(11):1119-25. DOI: 10.1016/0167-8655(94)90127-9
[14] Holube I, Fredelake S, Vlaming M, Kollmeier B. Development and analysis of an International Speech Test Signal (ISTS). Int J Audiol. 2010 Dec;49(12):891-903. DOI: 10.3109/14992027.2010.506889
[15] Byrne D, Dillon H, Tran K, Arlinger S, Wilbraham K, Cox R, Hagerman B, Hetu R, Kei J, Lui C, Kiessling J, Nasser Kotby M, Nasse NHA, El Kholy WAH, Y Nakanishi, Oyer H, Powell R, Stephens D, Meredith R, Sirimanna T, Tavartkiladze G, Frolenkov GI, Westerman S, Ludvigsen C. An international comparison of long-term average speech spectra. J Acoust Soc Am. 1994;96(4):2108-20. DOI: 10.1121/1.410152
[16] Scollie S, Seewald R, Cornelisse L, Moodie S, Bagatto M, Laurnagaray D, Beaulac S, Pumford J. The Desired Sensation Level multistage input/output algorithm. Trends Amplif. 2005;9(4):159-97. DOI: 10.1177/108471380500900403
[17] Keidser G, Dillon H, Flax M, Ching T, Brewer S. The NAL-NL2 Prescription Procedure. Audiol Res. 2011 May;1(1):e24. DOI: 10.4081/audiores.2011.e24
[18] Digeser FM, Engler M, Hoppe U. Comparison of bimodal benefit for the use of DSL v5.0 and NAL-NL2 in cochlear implant listeners. Int J Audiol. 2020 May;59(5):383-91. DOI: 10.1080/14992027.2019.1697902
[19] Engler M, Digeser F, Hoppe U. Prädiktion des Sprachverstehens mit Hörgerät: Neue Erkenntnisse durch Machine-Learning-Modelle. In: Deutsche Gesellschaft für Audiologie e. V.; ADANO, editors. 27. Jahrestagung der Deutschen Gesellschaft für Audiologie und Arbeitstagung der Arbeitsgemeinschaft Deutschsprachiger Audiologen, Neurootologen und Otologen. Göttingen, 19.-21.03.2025. Düsseldorf: German Medical Science GMS Publishing House; 2025. Doc078. DOI: 10.3205/25dga078
Erratum
The note “Cumulative dissertation” was added.


