Can cochlear implant users distinguish talkers by their voices?
Eva Schwarz 1Martin Durisin 1
Beate Stadler 1
1 Otto-von-Guericke-Universität, HNO-Klinik, Magdeburg, Germany
Abstract
Research question: A hearing implant is intended to enable people who are deaf or severely hard of hearing to understand speech again. While the cochlear implant (CI) fulfils the function of recognizing sound generally for a large number of CI patients, questions remain about the more detailed aspects of hearing. For successful communication it is also important to be able to perceive speech qualities beyond simply sound detection, however, the CI is limited in its technical ability to transmit certain acoustic signals. In order for CI users to be able to recognize voices and follow conversation, they must be able to distinguish between talkers and their voices in conversational situations. Up to now, studies on talkers’ discrimination by CI users have mainly studied the sensitivity to the distinction between female and male voices. The perception of the formant frequencies of the voice (timbre), which is dependent on the length of the vocal tract, has been mostly unexamined until now. In our study, we investigated the extent to which CI users were able to differentiate between talkers based on individual speech patterns and vocal characteristics.
Methods: In our current study, only female or male talkers were presented to the CI users in two rounds. Three female and three male talkers were selected from the OLLO corpus. The task of the CI users was to decide in an equal-unequal paradigm whether the stimulus pair was spoken by the same or by different talkers. So far, 165 experienced CI users (age: 17–92 years) have taken part in our accompanying study.
Result: In our study, the hit rates of correctly matched talkers were approx. 64% for female talkers and approx. 68% for male talkers, each about the chance level of 50%. Using the Wilcoxon signed rank test these results appear statistically significant (p<0.001).
Conclusion: CI users are able to differentiate between talkers according to differences in their vocal timbre.
Introduction
To date, studies on talker discrimination by cochlear implant (CI) users have frequently concentrated on the sensitivity to the distinction between female and male talker [3], [6], [7], [10]. This distinction essentially relates to the perception of the fundamental frequency (F0) of talker’s pitch. The perception of the formant frequencies of the voice (timbre), which is dependent on the length of the vocal tract, has been little investigated until now [2], [4].
The purpose of our study is to investigate whether CI users are able to perceive these qualitative tonal differences.
Material
Two speech scientists with expertise in hearing analysis selected female and male talkers from the OLLO corpus (OLdenburg LOgatome speech corpus, [12]). During the selection process, it was ensured that the stimuli exhibited greater differentiation in terms of vocal tone (timbre) than in speaking style. It was of the utmost importance that the samples did not contain any dialectal features (such as rolled ‘r’s) and that regional dialect was kept to a minimum (such as backshifted articulation). Additionally, the selected talker must be free of any speech disorders (e.g. sigmatism) or voice disorders (e.g. hoarseness). In consideration of the aforementioned criteria, three female and three male voices were selected from the OLLO corpus, specifically F4, F8, F9, M2, M3, and M6. It was imperative that the study design included two talkers with similar auditory characteristics and one talker with a different auditory profile.
The selected logatoms were presented in a vowel-consonant-vowel (VCV) structure, whereby the consonant should be voiced so that the talker’s voice sound extends over the entire stimulus (e.g. ‘adda’, but not ‘atta’). The stimuli were selected to include the vowel ‘a’, which is an open vowel, thus allowing the individual talker sound to be conveyed with optimal clarity. The selected stimuli were as follows: ‘abba’, ‘adda’, ‘agga’, and ‘amma’ providing a total of 24 stimuli across the six talkers.
A detailed acoustic (measured phonetically with PRAAT – [1]) and auditory description of the 24 selected stimuli was carried out as part of a Bachelor’s thesis [5].
The outlined phonetic parameters were as follows (see Figure 1 [Fig. 1]): pace of speech (in milliseconds), fundamental frequency/pitch (in hertz, with maximum, minimum, and average values), and intensity level (in decibels, with maximum and average values).
Figure 1: Representation of the phonetic measurement of the stimulus “amma” from talker M2 in PRAAT with the corresponding measurement parameters – blue line: pitch analysis, yellow line: intensity analysis, red dotted lines: Formant analysis (Günther [5])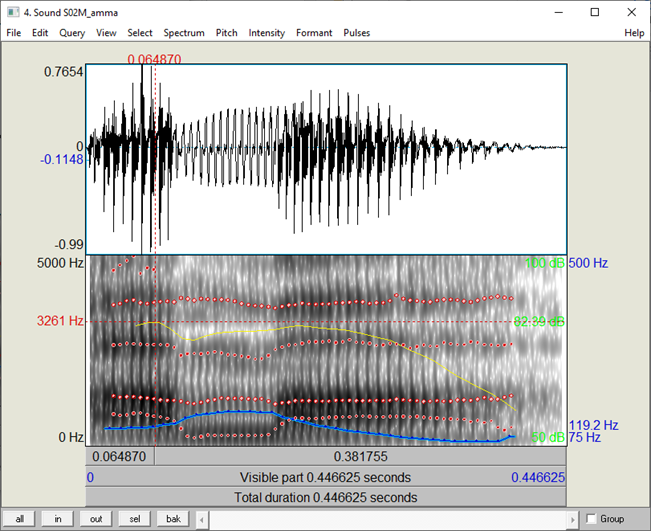
The catalogue of auditory characteristics included the following features: vocal sound (sonority, timbre, faucal distance, opening and closing phases, noisiness, stability, onset of the voice, RBH value – with roughness, breathiness, hoarseness), melody progression, precision of articulation, accentuation, and speech tension.
In this study, the characteristics that differentiated the talker were subjected to comparative analysis. It was demonstrated that the female voices of talkers F4 and F9 were similar to each other, while talker F8 exhibited a greater degree of differentiation in quality. For the male voices, talkers M2 and M3 were similar, while talker M6 differed from the other two.
Methods
In this study, participants were presented with either exclusively female or exclusively male talkers in two rounds. The stimuli were presented in an audiometric booth at the ENT clinic. CI users with speech processor devices OPUS2, Freedom, and CP810 were presented with the stimuli using a calibrated near-field monitor at a distance of one metre in front of the CI user. For participants using speech processor devices CP910, Sonnet, Kanso, Rondo or later introduced processor models, the stimuli were presented directly via the speech processor (cable, MiniMic, AudioLink, T-coil) at a volume level perceived as comfortable by the user. Both unilateral and bilateral CI users were included into the study. For all of the patients only the implanted side or the preferred implanted ear respectively was used during the tests.
To date, 165 experienced cochlear implant (CI) users (period of use >1y 3m), comprising 86 women and 79 men, aged 17 to 92 years, have participated in our study. Of these, 82 left and 83 right ears were measured. Of the CI users, 77 were using a Cochlear and 88 a MED-EL.
The presentation of stimuli was conducted using the PsychoPy® software (Psychophysics software in Python [8], [9]), with the stimuli presented in a randomised order.
For each rating, participants were presented with two different logatomes, spoken by either two different talkers or twice by the same talker. The task was to indicate whether the same or different talkers had spoken the stimulus pair just heard in an equal-unequal 2-AFC-paradigm (two alternative forced choice). Responses were recorded via a touch screen monitor.
Results
Normal-hearing subjects (NH group)
In order to determine the efficacy with which the stimulus material could be distinguished, the tests were first carried out in normal-hearing subjects using the aforementioned study design, but with headphones.
A total of 12 women and 18 men, aged between 23 and 78 years, participated in this preliminary study. The measurements were taken from 30 subjects, selecting 15 left ears and 15 right ears. To ensure monaural hearing, the stimuli were presented to the subjects using headphones that would play the sounds in only one ear. The results, as illustrated in Figure 2 [Fig. 2], demonstrated that the NH group exhibited an average recognition rate of 77% for female talkers and 77% for male talkers. This performance exceeded the chance level of 50%.
Figure 2: Mean results for female and male talkers in the NH group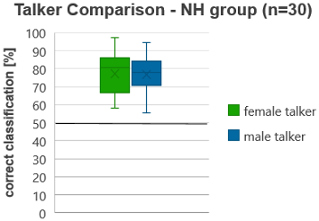
The three different female talkers could be matched equally well by the NH group when comparing voices from the same gender (Figure 3a [Fig. 3]) (F4 – 79%, F8 – 80%, F9 – 78%), while within the male talkers (Figure 3b [Fig. 3]) this was most difficult for talker M2 (62%), easier for M3 (74%) and easiest for M6 (84%).
Figure 3: Normal hearing group: Classification rates depending on talkers’ gender: a) female and b) male talkers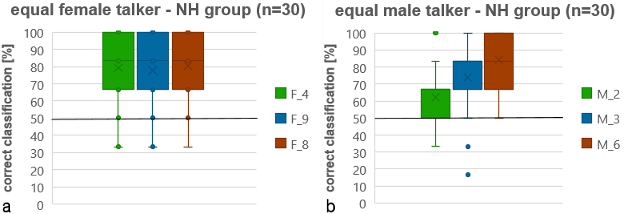
Comparing different talkers the female talkers (Figure 4a [Fig. 4]) were identified to varying degrees by the NH group. Talkers F4 and F9 were frequently interchanged (44%), and their classification was challenging. Comparing female talkers F4 and F8 (89%) as well as F8 and F9 (92%), the NH group demonstrated no difficulty in distinguishing between them.
Figure 4: Comparative analysis of the unequal talkers of a) female and b) male talkers in the NH group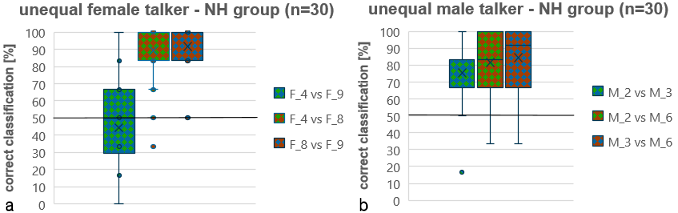
Among the unequal male talkers (Figure 4b [Fig. 4]), the NH group exhibited the greatest difficulty in distinguishing between talkers M2 and M3 (76%). It was easier for them to distinguish the voices of talkers M2 and M6 (82%) and talkers M3 and M6 (84%).
CI users (CI group)
The results, as illustrated in Figure 5 [Fig. 5], demonstrated that the CI group exhibited an average recognition rate of 64% for female talkers and 68% for male talkers compared to the chance level of 50%.
Figure 5: Classification rates depending on talkers’ gender of female and male talkers in the CI group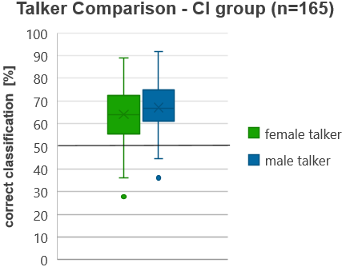
When comparing equal female talkers, the CI group (Figure 6a [Fig. 6]) demonstrated an equal ability to match each talker (F4 – 64%, F8 – 62%, F9 – 63%). In contrast, within the male talkers (Figure 6b [Fig. 6]), this was more challenging for talker M3 (66%) and more straightforward for talkers M2 and M6 (70% each).
Figure 6: CI group: classification rates depending on talkers’ gender: a) female and b) male talkers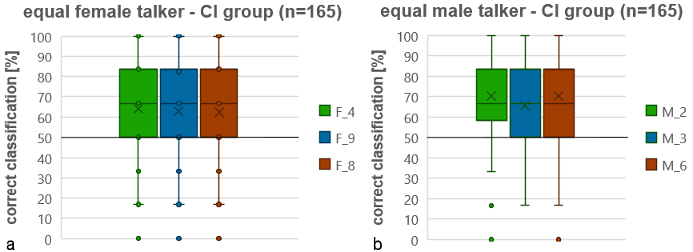
A comparison of the results achieved for the unequal female talkers (Figure 7a [Fig. 7]) demonstrated that the CI group exhibited partial ability to distinguish between them. The hit rate for female talkers F4 and F9 in the CI group was 49%, indicating that these two talkers could not be distinguished. A notable degree of discrimination was observed when comparing talkers F4 and F8, with the group demonstrating a 66% hit rate. This was further enhanced when comparing F8 and F9, with an 80% hit rate.
Figure 7: CI group: classification rates depending on talkers’ gender: a) female and b) male talkers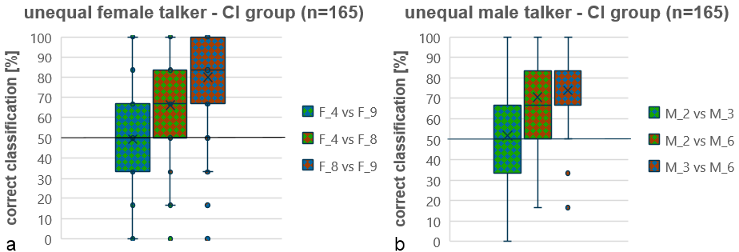
The CI group demonstrated an inability to distinguish between talkers M2 and M3 within the male voices, with a hit rate near the chance level (52%) (Figure 7b [Fig. 7]). However, they exhibited the capacity to distinguish the voices of talkers M2 and M6 (71%) and talkers M3 and M6 (74%).
Conclusion
The results of the measurements between the CI and NH groups are comparable in that both groups exhibited greater difficulty discriminating between talkers with similar acoustic features than when comparing talkers with differing acoustic features, which held true for both males and females. This suggests that individuals with cochlear implants can utilize vocal features to discriminate between talkers in a manner analogous to individuals with normal hearing, despite the potential limitations in this ability.
Notes
Conference presentation
This contribution was presented at the 26th Annual Conference of the German Society of Audiology and published as an abstract [11].
Competing interests
The authors declare that they have no competing interests.
References
[1] Boersma P, Weenink D. Praat, a system for doing phonetics by computer. Glot International. 2001;5(9/10):341-5.[2] Colby S, Orena AJ. Recognizing Voices Through a Cochlear Implant: A Systematic Review of Voice Perception, Talker Discrimination, and Talker Identification. J Speech Lang Hear Res. 2022 Aug 17;65(8):3165-94. DOI: 10.1044/2022_JSLHR-21-00209
[3] Fu QJ, Chinchilla S, Galvin JJ. The role of spectral and temporal cues in voice gender discrimination by normal-hearing listeners and cochlear implant users. J Assoc Res Otolaryngol. 2004 Sep;5(3):253-60. DOI: 10.1007/s10162-004-4046-1
[4] Gaudrain E, Başkent D. Discrimination of Voice Pitch and Vocal-Tract Length in Cochlear Implant Users. Ear Hear. 2018 Mar/Apr;39(2):226-37. DOI: 10.1097/AUD.0000000000000480
[5] Günther F. Anhand welcher sprecherischen Merkmale unterscheiden Hörer Sprecher? – Experimentelle Studie zum Oldenburger Logatomtest [unpublished bachelor thesis]. Halle: Martin-Luther-Universität Halle-Wittenberg; 2014.
[6] Mühler R, Ziese M, Rostalski D. Development of a speaker discrimination test for cochlear implant users based on the Oldenburg Logatome corpus. ORL J Otorhinolaryngol Relat Spec. 2009;71(1):14-20. DOI: 10.1159/000165170
[7] Mühler R, Ziese M, Verhey JL. Sprecherunterscheidung mit Cochleaimplantaten [Speaker discrimination in cochlear implant users]. HNO. 2017 Mar;65(3):243-50. DOI: 10.1007/s00106-016-0225-8
[8] Peirce JW. Generating Stimuli for Neuroscience Using PsychoPy. Front Neuroinform. 2009 Jan 15;2:10. DOI: 10.3389/neuro.11.010.2008
[9] Peirce JW. PsychoPy--Psychophysics software in Python. J Neurosci Methods. 2007 May 15;162(1-2):8-13. DOI: 10.1016/j.jneumeth.2006.11.017
[10] Rahne T, Ziese M, Rostalski D, Mühler R. Logatome discrimination in cochlear implant users: subjective tests compared to the mismatch negativity. ScientificWorldJournal. 2010 Feb 19;10:329-39. DOI: 10.1100/tsw.2010.28
[11] Schwarz E, Durisin M, Stadler B. Können Sprechende von CI-Tragenden nach ihren Stimmen unterschieden werden? In: Deutsche Gesellschaft für Audiologie e.V., editor. 26. Jahrestagung der Deutschen Gesellschaft für Audiologie. Aalen, 06.-08.03.2024. Düsseldorf: German Medical Science GMS Publishing House; 2024. Doc084. DOI: 10.3205/24dga084
[12] Wesker T, Meyer B, Wagener K, Anemüller J, Mertins A, Kollmeier B. Oldenburg Logatome Speech Corpus (OLLO) for Speech Recognition Experiments with Humans and Machines. In: INTERSPEECH 2005 - Eurospeech, 9th European Conference on Speech Communication and Technology; 2005 Sep 4-8; Lisbon. ISCA; 2005. p.1273-6. DOI: 10.21437/Interspeech.2005-485