Bodyweight, body condition and anatomy
Martin Weisbjerg 2
Alex Bach 3
Jennifer Salau 4
Jan Henning Haas 5
Wolfgang Junge 5
Georg Thaller 5
Björn Kuhla 1
1 Leibniz Institute for Farm Animal Biology (FBN), Dummerstorf, Deutschland
2 Aarhus University, Tjele, Dänemark
3 Institució de Recerca i Estudis Avançats (ICREA), Barcelona, Spain
4 Kiel University, Kiel, Deutschland
5 Kiel University, Kiel, Germany
Keywords
weight scale, ultrasound, back fat thickness, 3D imagingIntroduction
Measuring bodyweight (BW) in cattle is essential for many research and management activities such as calculating dietary energy requirements for maintenance, calculating average daily gain and evaluating breeding values which include BW as a trait. Frequent monitoring of BW in dairy cows is necessary as changes in BW can help assess the energy balance of an animal [1]. Precise understanding of BW gain of growing and fattening cattle or body mass changes during lactation is crucial in developing nutritional management programs and assessing feed efficiency, as well as the overall animal health status [2], [3]. Weigh scales are the most widely used method for determining BW in cattle, despite being time-consuming and potentially costly to implement [4]. Current advancements in technology have led to the development of automated weighing scales. Such technologies provide a more sensitive and less labour-intensive approach for measuring BW changes in cattle [5]. However, few investigations have been conducted to validate and compare automated walk-over weighing scales, coupled with radio frequency identification (RFID) ear tags, with conventional static weighing scales [6], [7].
Cows, like other dams, support their offspring via recruiting their tissue energy reserves. Therefore, they lose ''condition'' for the first few months postpartum [8], [9] and restore the mobilised tissue [10], [11] by the end of lactation. Intensive genetic selection for early lactation and total milk yield has put pressure on the modern dairy cow to increase mobilisation of energy reserves to meet the increased demands [12], [13]. The extent of body fat mobilisation in early lactation is inversely associated with the level of feed intake and an increased risk of the incidence of diseases such as ketosis, acidosis, fatty liver, lameness and abomasal displacement. Several factors, e.g., parity, calving season [14], stage of lactation, feeding level and dietary composition [15], have been shown to influence body condition of cattle. During the 1970s and 80s, a set of standards was introduced to subjectively evaluate the amount of stored energy reserves in cattle and scores were developed, reflecting the degree of apparent adiposity of the cow. These scores are commonly referred to as body condition scores (BCS). The manual assessment of BCS is time-consuming and requires good training but is still the ''preferred'' or standard method in most cattle units (commercial and research farms). The BCS scoring system differs slightly globally. Lowman [16] appears to be among the first to establish a BCS scale in dairy cattle (4-point system). A ten- (1 to 10), 8- (1 to 8) and 5- (1 to 5) point scaling system were developed in New Zealand, Australia and the Unites States, respectively. In New Zealand, Great Britain and Ireland, BCS evaluation is done by palpating distinct anatomical locations, whereas in the United States and Australia, the same body parts will be evaluated visually. Despite these scaling differences, low and high scores reflect emaciation and obesity, respectively, in all methods. Roche [17] determined the relationship between the aforementioned visual and physical BCS scaling systems and revealed weak correlations in visual evaluation systems. The study showed that visual assessment generally places more or less emphasis on particular anatomical locations of cow, compared with palpating systems.
Various attempts have been made to appraise BCS in cattle using automated systems [18], [19] but they are not able to fully replace the manual scoring system. Studies related to the use of 3D imaging systems are rapidly increasing due to improved machine vision technology and reduction in costs [20], [21], [22]. Vázquez-Arellano [23] elaborated the use of imaging systems for the agricultural sector. Time of flight (TOF) cameras are able to generate a 3D image by utilising an infrared source and a charge coupled device [24]. Researchers were able to determine the BCS of cows using the TOF camera, based on extracting different body parts of the animal and/or back postures in 3D images [20], [25].
Another way to estimate stored energy reserves in cattle is to measure the back-fat thickness (BFT) via ultrasonography, often seen as a complementary approach to BCS determination. The association range of degree between BFT outcome and BCS has shown to be high [26], [27], [28]. This could be the result of different factors such as misinterpretation of ultrasound images by the operator, limited anatomical location for BFT measurement compared with BCS, level of animal fatness or hide thickness. Back-fat is the layer of subcutaneous fat between the skin and the deep fascia of the trunk, in this case located above the gluteus medius and longissimus dorsi muscles [29]. As with other ultrasonography examinations, this method requires a good knowledge of the animal’s anatomy and the ability to correctly analyse the obtained ultrasound images.
Milking performance, udder health and conformation are among the functional traits that manipulate milk production indirectly. Genetic correlations suggest that selection for udder traits and angularity should improve longevity in the Holstein cattle population [30]. Hence, udder anatomy, particularly milk storage capacity, could play an important role in determining milk yield [31]. Measuring the udder volume in livestock seems to be a useful aid to assess the pattern of mammary development, because repeated measurements can be made in the same animals, through time. However, the technique does not provide any information on potential alterations in mammary tissue composition [32]. Moulding with either polyurethane [33] or aluminium foil [34] has been shown to be a quick method for assessing udder volume.
Bodyweight
Prerequisite
A general assumption is made for this guideline that the research institutes have either a static, an automatic, or both weighing scales within their unit. The Animal Trait Ontology for Livestock (ATOL) number linked with this guideline is: ATOL_0000351 (for complete list of ATOL please visit http://www.atol-ontology.com/en/erter-2).
A – Frequency and preparation
- BW measurements must be performed at least once, prior to and at the end of the experiment. Depending on the duration of the experiment and the technical applicability, BW measurements should also be done during the experimental period. It is recommended to measure BW more than once before, during, and after the experiment, to minimize the impact of day-to-day variations in water and gut fill. Additionally, BW measurements should be conducted at the same time of day because BW fluctuate depending on the time relative to feeding and milking.
- Weighing scales must be calibrated and balanced to zero prior to use, using accurate calibration weights [7].
B – Static BW scales
- Movement of the animal to the weighing platform should be done with great care causing minimal stress to the animal.
- Operatives must ensure that the animal is standing correctly, with all legs on the weighing platform. It is also necessary to ensure that the animal does not lean on any barriers, which are not mounted onto the weighing platform.
- Operatives should not touch the cage or step on the weigh platform during weighing.
- The electric power of the digital scale should be left on continuously.
C – Automated BW scales
- The automatic walk-over weighing scales must be positioned in a way that is natural and easy to pass over for animals (e.g. at the exit race of the milking parlour).
- The validation and agreement of the automatic BW assessment system has to be done by comparing the obtained data of technical objects with the digital static scaling.
- The accuracy of the system must be checked by plotting static against automated weight measurements and observing the closeness of the line of best fit to the 45° line (slope of 1) through the intercept [35], [36]. Precision of the system should be defined as how far observations deviate from the line of best fit.
- For automatic weighing scales, it must be ensured that the electronic identifier in animal’s ear tag, the antenna and the weighing scale are functioning correctly.
- For automatic weighing scales, cow flow over the scale platform must be carefully monitored (e.g. avoiding more than 1 cow simultaneously standing on the scale platform or the animal standing partially on the scale platform) in order to prevent erroneous measurements.
- Unless the instrument is equipped with individual flow control, a staff member must observe animals traversing the automatic weighing scale platform and note any abnormal crossings. Any BW data from abnormal crossings should be omitted.
- The method used to detect and remove outlying data in automatic BW measurements must be clear and described in detail.
- The accuracy and precision of automatic weighing scales should be tested every two weeks.
Body condition scoring
Prerequisites
The guideline describes visual evaluation of BCS and assumes a 5-point BCS scale method will be carried out, as this scoring system is used in many European countries. Moreover, a section has been dedicated on assesing BCS using a Time-Of-Flight imaging system. The Animal Trait Ontology (ATOL) and Environment Ontology (EOL) for Livestock number linked with this guideline is: ATOL_0000092, ATOL_0001517, EOL_0001741 and EOL_0000040 (for complete list of ATOL please visit http://www.atol-ontology.com/en/erter-2).
A – Frequency and preparation
- Body condition scoring should be done using a 1 to 5 scale for better overall consistency and accuracy [37].
- In an experimental trial, BCS assessment must be carried out prior to the trial, at set intervals during the trial (e.g. weekly or 10-day intervals) and at the end of the trial.
- Body condition scoring should be performed 2–4 h after feeding at the same time of the day.
- The animal must be standing for BCS assessment.
- Animals should be handled with care during BCS evaluation as any muscle tightness as a result of stress will result in inaccurate scoring.
- BCS assessment should not be carried out in a dehydrated animal as this will lead to inaccurate scoring.
B – “Condition” scoring
- The loin and the tailhead area (particularly around the pelvis from the pin bones to the top of the tailhead) of the animal should be palpated for scoring.
- The BCS operator should assess the hooks, pins, thurls (hip joint), short ribs and the sacral, as well as tailhead ligaments, from the rear.
- The BCS operator should also view the animal from the side and check the visibility of hooks, pins, thurls and short ribs.
- The final BCS is the average of the scores from the rear and side view.
- The member of staff, carrying out the BCS assessment, should be trained by an experienced observer and use the same scoring system throughout her/his evaluation, as BCS is inherently a subjective method.
- For consistent evaluations, the same staff member should score cattle throughout an experiment. Ideally, 2 scorers perform the BCS assessment, thereby accounting for any bias between scorers. Moreover, this individual should perform the BCS at the same time of day, as far as is possible.
- In the case of a BCS of <2 or ≥5, this may indicate health problems and the animal should be carefully observed.
C – Automated body condition monitoring with Time-Of-Flight camera
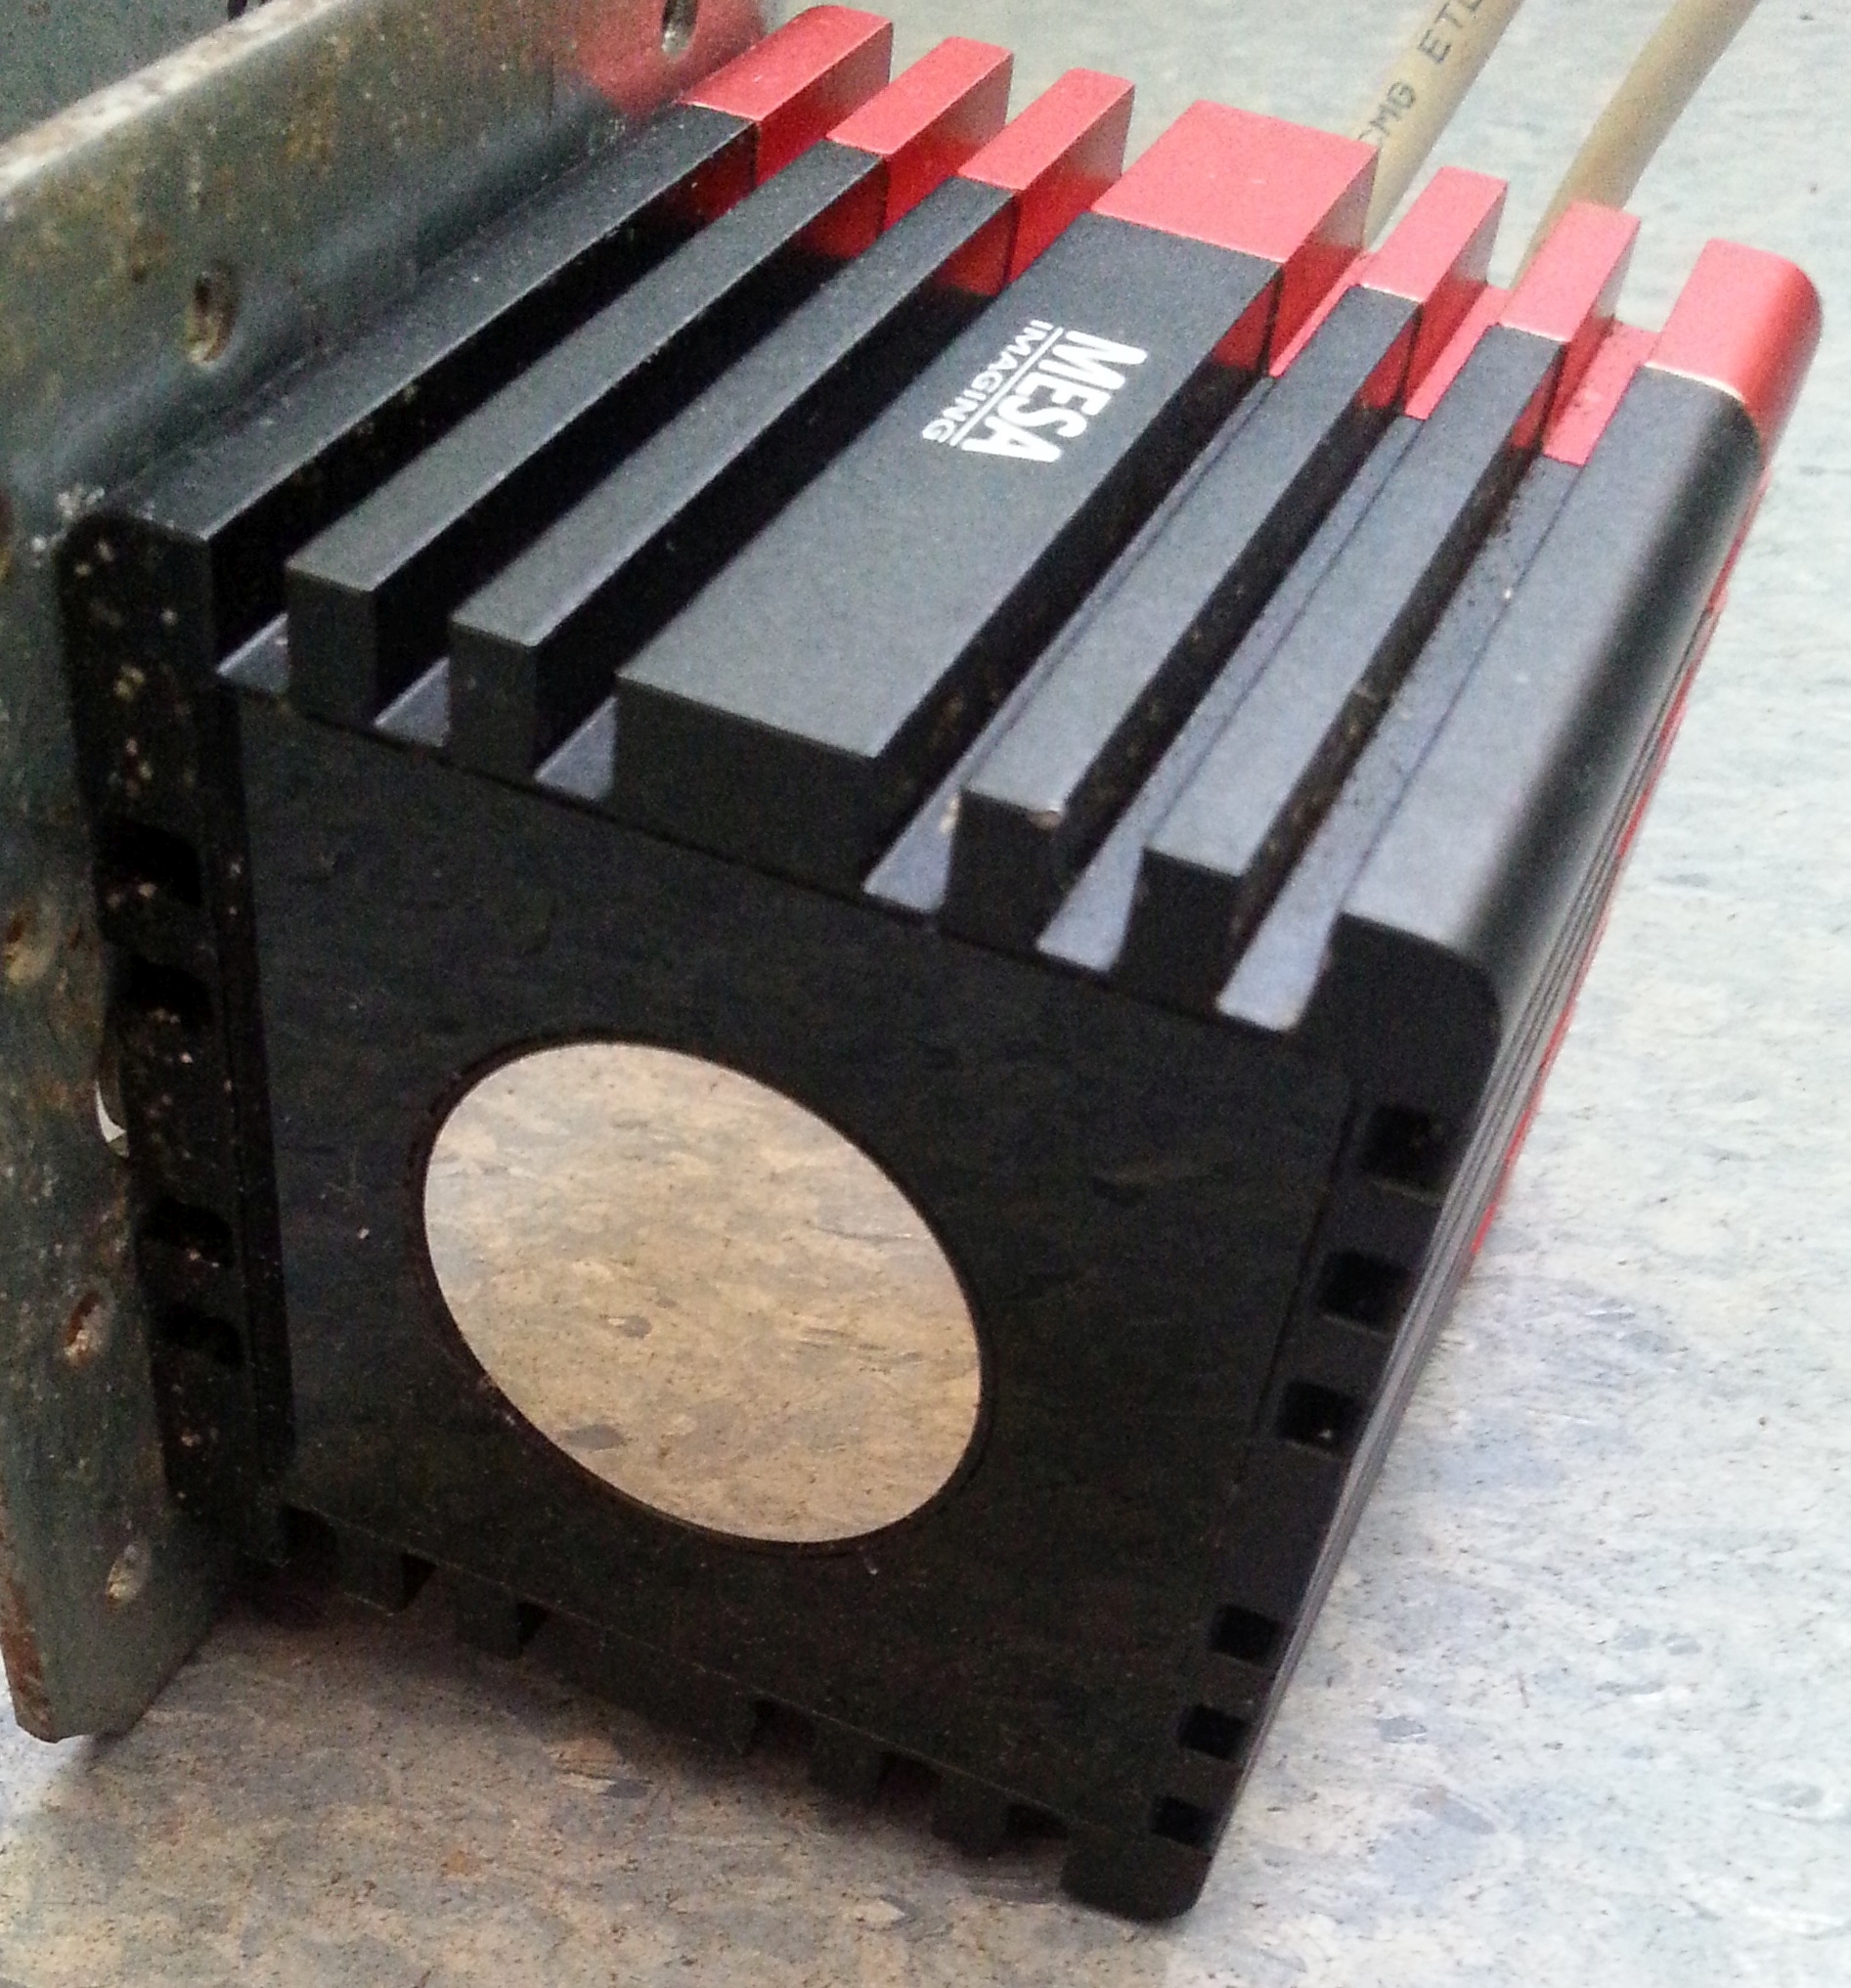
The experience includes only Holstein-Friesian cows kept in a freestall barn with automatic feeding dispensers, equipped with animal identification (RFID) and a SR4000 Time-Of-Flight camera (Figure 1, http://www.adept.net.au/cameras/Mesa/SR4000.shtml).
i. Camera settings and installation
- It is necessary that the used camera meets an industrial standard of at least IP64 (https://www.mpl.ch/info/IPratings.html).
- Unless the setting of the present experiment dictates otherwise, the default settings of the SR4000 camera are recommended.
- The camera range of the SR4000 is 0.8 to 8 m. In a cow barn setting with humidity and diffuse light conditions, it is recommended to install the camera not further than 1.50 m from the object of interest.
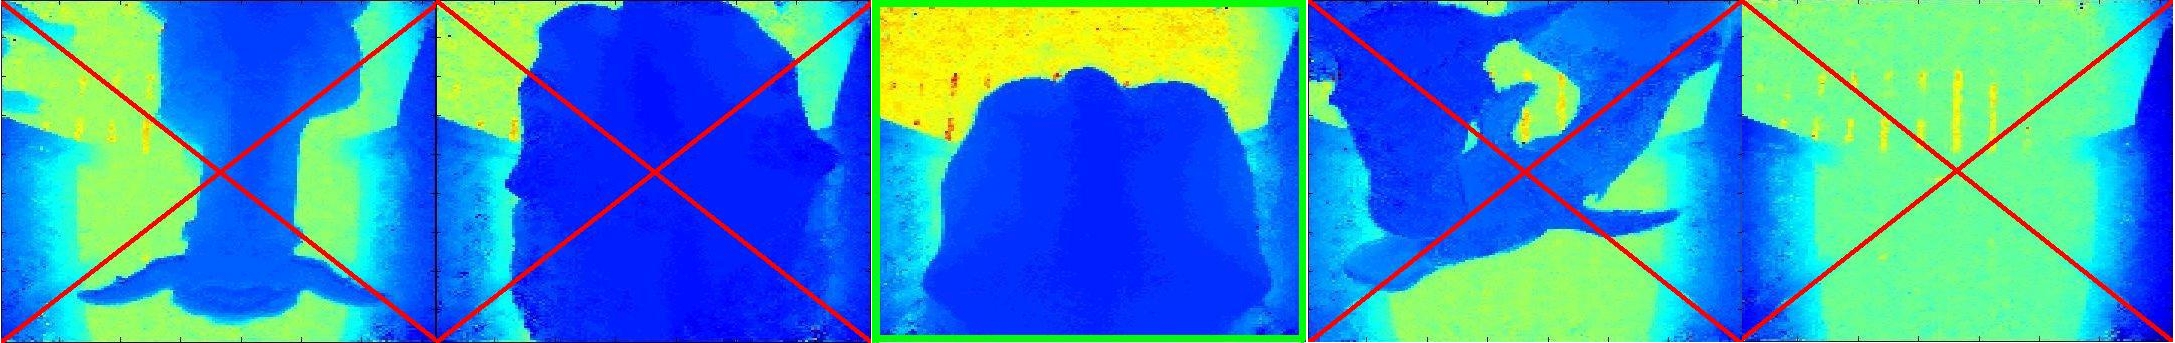
- The SR4000 has a horizontal field of view (FOV) of 43.6° and a vertical FOV of 34.6°. With a 1.50 m distance from the object, an area of approximately 1.20 m × 0.90 m can be observed. Because of narrow FOV, careful positioning of the camera and the animal is necessary (see Figure 2).
- Due to the Time-Of-Flight measurement principle used with the SR4000, the camera should be shielded from direct sunlight.
- A fixed camera installation with the possibility to identify the recorded animal is recommended (for example: above an electric feeding dispenser with RFID).
ii. Recording and image selection
- The SR4000 comes with an Application Programming Interface (API). Use this API to implement software for the setting of camera parameters, starting and stopping the camera, the acquisition of images from the camera, and data storage.
- The recording software should be run on a computer where a connection to an ID system is possible, so that the recorded material with regard to animal identification can be sorted.
- In cases where the animal identification of an electric feeding dispenser is used, the protocol of this ID system is needed, to know how to filter for the identification of the animal actively feeding.
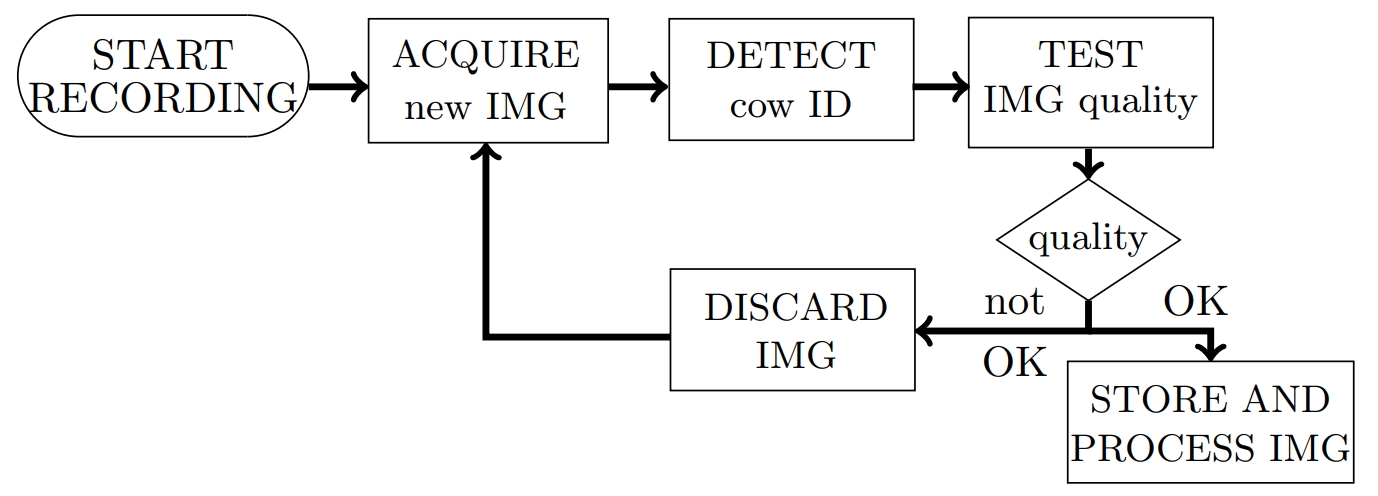
- In order to minimize the amount of recorded material, images acquired from the camera should only be stored when they can be mapped to a specific cow through animal identification. Additionally, the stored images should have undergone several tests concerning quality and usability for the desired purpose (Figures 2 and 3).
- For image processing, it is helpful to gather scenery information, i.e. record the unmovable background objects in the FOV of the firmly installed SR4000.
- If the SR4000 is running continuously, it is recommended to renew this scenery information after a specified time interval because manure and barn management routines might vary the scenary. This, in turn, might affect the applied image processing that rely on scenery information.
- The SR4000 outputs depth images with a resolution of 176 x 144 pixels. The pixel values correspond to the distance between camera and object.
- It is necessary to preprocess the raw data in terms of foreground definition. As an essential step, it is recommended to subtract the unmovable background (scenery information, see ii-5.) from the raw data calculating the pixel differences. It may be necessary to refine the results using additional methods (i.e. thresholds, depth value histograms).
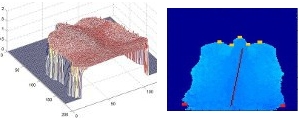
- The data recorded from the animal can be visualized as surface (Figure 4, left).
- It is mandatory to implement a routine procedure to define the region of interest (ROI) within the foreground. ROI, can for example, be points on the animal’s surface (Figure 4, right) associated to the possible measurement of the target variable (BCS, BFT).
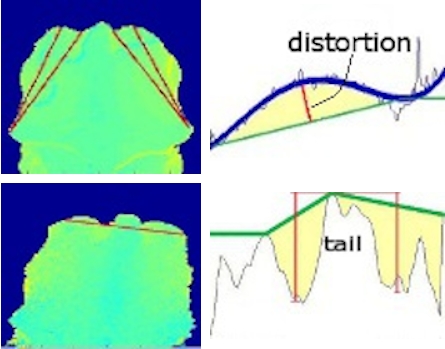
- Parameters such as distances, curvatures and volumes can be calculated from profiles taken along sections through the surface to estimate the target variable (see Figure 5 for example).
iv. Validation
- The results of the image quality and usability tests (see ii-4.) as well as the foreground definition (see iii-2.) and the ROI definition (see iii-4.) need to be checked carefully, as all further calculations are based on the results of these procedure.
- To validate the preprocessing, randomly choose images for visual inspection that were taken from various animals and on different days.
v. Limitations in depth data quality
- The number of images with acceptable depth data quality decreases quadratically with increasing velocity of the animal.
- Significant differences in depth data quality between black and white fur need to be taken into account.
Back fat thickness
Prerequisite
This guideline describes BFT measurements of cattle using ultrasound. The Animal Trait Ontology for Livestock (ATOL) number linked with this guideline is: ATOL_0001517 (for complete list of ATOL please visit http://www.atol-ontology.com/en/erter-2).
- Handling of the animal should be done carefully to minimise any potential stress. The animal should be standing and in a relaxed posture prior to measurment.
- The surrounding area of skin should be cleaned prior to examination.
- Skin should be wet either using 70–80% diluted alcohol, gels or water for better contact with the transducer.
- If possible, a portable B-mode ultrasound containing linear transducer with a frequency range of 5.0 and 7.5 MHz should be available in the unit for optimal imaging and accurate measurement of BFT.
- The transducer must be positioned in a vertical manner between the hooks and pins at the sacral region [29].
- The transducer should not be handled with pressure as this causes the fat to compress and the transducer should be in a perpendicular orientation to the tissue interface at the time of measurement.
- The transducer should be moved across the examination site slowly and with care. This allows a better and clearer interpretation of the image.
- As the subcutaneous back fat layer is located above the gluteus medius and longissimus dorsi muscles, between the skin and deep fascia of the trunk, thickness of the skin, connective tissue and muscle should be excluded from the final BFT measurement.
- The BFT measurement must be done on the same day as body condition scoring, when it is being used assessing the condition of cattle.
- The BFT measurements of cattle have to be performed on the same anatomical position.
- When evaluating the condition of an animal, the same operator should perform the BFT measurements and the BCS assessment.
- The operator should have sufficient knowledge of bovine anatomy to allow him to measure the BFT precisely and should have been trained by an experienced researcher.
- The operator should have sufficient knowledge and ability to correctly analyse the obtained ultrasound images.
Mammary gland volume
Prerequisite
The present guideline aims to provide steps in performing a mammary gland volume measurement using aluminum foil in cows (for more details see [34]). The Animal Trait Ontology for Livestock (ATOL) number linked with this guideline is: ATOL_0000235 (for complete list of ATOL please visit http://www.atol-ontology.com/en/erter-2).
- The operator ought to use a double layer of aluminum for casting the udder. The aluminum sheet size has to be estimated for each udder, with its measure being based on previous observations.
- The method should be calibrated, using 5–10 cows at two different milking times, prior to the actual trial.
- The aluminum sheet needs to be attached and carefully mold the udder. When necessary, the operator can use stripes of masking tape to support the aluminum cast attachment as well as to avoid misshaping of the cast. The striping will also give extra strength to the cast, which allows possible manipulations necessary for measuring its volume.
- The casting procedure must be done as quickly as possible (roughly 1–2 min), in order to minimize the risk of the staff member being hurt by the animal, along with reducing the stressful conditions for the animal.
- The animal has to be restrained prior to and after milking for the measurement. The handling of the animal should not induce any unnecessary stress.
- The operator is able to administer exogenous oxytocin (10 UI) in order to obtain a completely empty udder.
- After a particular cast is ready, polyurethane particles need to be used for determining the inner volume (L) of the aluminum cast.
- The differences (L) between a full and empty udder volume has to be compared with the volume of milk obtained from milking (L).
References
[1] Mäntysaari P, Mäntysaari EA. Modeling of daily body weights and body weight changes of Nordic Red cows. J Dairy Sci. 2015;98:6992-7002. DOI: 10.3168/jds.2015-9541[2] Dingwell RT, Wallace MM, McLaren CJ, Leslie CF, Leslie KE. An Evaluation of Two Indirect Methods of Estimating Body Weight in Holstein Calves and Heifers. J Dairy Sci. 2006;89:3992-8. DOI: 10.3168/jds.S0022-0302(06)72442-0
[3] Enevoldsen C, Kristensen T. Estimation of Body Weight from Body Size Measurements and Body Condition Scores in Dairy Cows. J Dairy Sci. 1997;80:1988-95. DOI: 10.3168/jds.S0022-0302(97)76142-3
[4] Heinrichs AJ, Rogers GW, Cooper JB. Predicting body weight and wither height in Holstein heifers using body measurements. J Dairy Sci. 1992;75:3576-81. DOI: 10.3168/jds.S0022-0302(92)78134-X
[5] Roche JR, Lee JM, Macdonald KA, Berry DP. Relationships Among Body Condition Score, Body Weight, and Milk Production Variables in Pasture-Based Dairy Cows. J Dairy Sci. 2007;90:3802-15. DOI: 10.3168/jds.2006-740
[6] Alawneh JI, Stevenson MA, Williamson NB, Lopez-Villalobos N, Otley T. Automatic recording of daily walkover liveweight of dairy cattle at pasture in the first 100 days in milk. J Dairy Sci. 2011;94:4431-40. DOI: 10.3168/jds.2010-4002
[7] Dickinson RA, Morton JM, Beggs DS, Anderson GA, Pyman MF, Mansell PD, et al. An automated walk-over weighing system as a tool for measuring liveweight change in lactating dairy cows. J Dairy Sci. 2013;96:4477-86. DOI: 10.3168/jds.2012-6522
[8] Sumner JM, McNamara JP. Expression of Lipolytic Genes in the Adipose Tissue of Pregnant and Lactating Holstein Dairy Cattle. J Dairy Sci. 2007;90:5237-46. DOI: 10.3168/jds.2007-0307
[9] Roche JR, Berry DP, Lee JM, Macdonald KA, Boston RC. Describing the Body Condition Score Change Between Successive Calvings: A Novel Strategy Generalizable to Diverse Cohorts. J Dairy Sci. 2007;90:4378-96. DOI: 10.3168/jds.2006-729
[10] Pryce JE, Harris BL. Genetics of Body Condition Score in New Zealand Dairy Cows. J Dairy Sci. 2006;89:4424-32. DOI: 10.3168/jds.S0022-0302(06)72490-0
[11] Berry DP, Veerkamp RF, Dillon P. Phenotypic profiles for body weight, body condition score, energy intake, and energy balance across different parities and concentrate feeding levels. Livest Sci. 2006;104:1-12. DOI: 10.1016/j.livsci.2006.02.012
[12] Lucy MC, Verkerk GA, Whyte BE, Macdonald KA, Burton L, Cursons RT, et al. Somatotropic axis components and nutrient partitioning in genetically diverse dairy cows managed under different feed allowances in a pasture system. J Dairy Sci. 2009;92:526-39. DOI: 10.3168/jds.2008-1421
[13] Chagas LM, Lucy MC, Back PJ, Blache D, Lee JM, Gore PJS, et al. Insulin resistance in divergent strains of Holstein-Friesian dairy cows offered fresh pasture and increasing amounts of concentrate in early lactation. J Dairy Sci. 2009;92:216-22. DOI: 10.3168/jds.2008-1329
[14] Pryce JE, Coffey MP, Simm G. The Relationship Between Body Condition Score and Reproductive Performance. J Dairy Sci. 2001;84:1508-15.DOI: 10.3168/jds.S0022-0302(01)70184-1
[15] Roche JR, Berry DP, Kolver ES. Holstein-Friesian Strain and Feed Effects on Milk Production, Body Weight, and Body Condition Score Profiles in Grazing Dairy Cows. J Dairy Sci. 2006;89:3532-43. DOI: 10.3168/jds.S0022-0302(06)72393-1
[16] Lowman BG, Scott NA, Somerville SH, East of Scotland College of Agriculture. Animal Production A, Department D. Condition Scoring of Cattle: Edinburgh School of Agriculture; 1976.
[17] Roche JR, Dillon PG, Stockdale CR, Baumgard LH, VanBaale MJ. Relationships Among International Body Condition Scoring Systems. J Dairy Sci. 2004;87:3076-9. DOI: 10.3168/jds.S0022-0302(04)73441-4
[18] Halachmi I, Polak P, Roberts DJ, Klopcic M. Cow Body Shape and Automation of Condition Scoring. J Dairy Sci. 2008;91:4444-51. DOI: 10.3168/jds.2007-0785
[19] Azzaro G, Caccamo M, Ferguson JD, Battiato S, Farinella GM, Guarnera GC, et al. Objective estimation of body condition score by modeling cow body shape from digital images. J Dairy Sci. 2011;94:2126-37. DOI: 10.3168/jds.2010-3467
[20] Salau J, Haas JH, Junge W, Bauer U, Harms J, Bieletzki S. Feasibility of automated body trait determination using the SR4K time-of-flight camera in cow barns. Springerplus. 2014;3:225. DOI: 10.1186/2193-1801-3-225
[21] Viazzi S, Bahr C, Van Hertem T, Schlageter-Tello A, Romanini CEB, Halachmi I, et al. Comparison of a three-dimensional and two-dimensional camera system for automated measurement of back posture in dairy cows. Comput Electron Agr. 2014;100:139-47. DOI: 10.1016/j.compag.2013.11.005
[22] Weber A, Salau J, Haas JH, Junge W, Bauer U, Harms J, et al. Estimation of backfat thickness using extracted traits from an automatic 3D optical system in lactating Holstein-Friesian cows. Livest Sci. 2014;165:129-37. DOI: 10.1016/j.livsci.2014.03.022
[23] Vázquez-Arellano M, Griepentrog HW, Reiser D, Paraforos DS. 3-D Imaging Systems for Agricultural Applications—A Review. Sensors. 2016;16:618. DOI: 10.3390/s16050618
[24] Kolb A, Barth E, Koch R, Larsen R. Time-of-Flight Cameras in Computer Graphics. Comput Graph Forum. 2010;29:141-59. DOI: 10.1111/j.1467-8659.2009.01583.x
[25] Fischer A, Luginbuhl T, Delattre L, Delouard JM, Faverdin P. Rear shape in 3 dimensions summarized by principal component analysis is a good predictor of body condition score in Holstein dairy cows. J Dairy Sci. 2015;98:4465-76. DOI: 10.3168/jds.2014-8969
[26] Domecq JJ, Skidmore AL, Lloyd JW, Kaneene JB. Validation of body condition scores with ultrasound measurements of subcutaneous fat of dairy cows. J Dairy Sci. 1995;78:2308-13. DOI: 10.3168/jds.S0022-0302(95)76857-6
[27] Jaurena G, Moorby JM, Fisher WJ, Cantet R. Association of body weight, loin longissimus dorsi and backfat with body condition score in dry and lactating Holstein dairy cows. Anim Sci. 2005;80:219-23. DOI: 10.1079/ASC41750219
[28] Schwager-Suter R, Stricker C, Erdin D, Künzi N. Relationship between body condition scores and ultrasound measurements of subcutaneous fat and m. longissimus dorsi in dairy cows differing in size and type. Anim Sci. 2000;71:465-70. DOI: 10.1017/S1357729800055375
[29] Schroder UJ, Staufenbiel R. Invited review: Methods to determine body fat reserves in the dairy cow with special regard to ultrasonographic measurement of backfat thickness. J Dairy Sci. 2006;89:1-14. DOI: 10.3168/jds.S0022-0302(06)72064-1
[30] Setati MM, Norris D, Banga CB, Benyi K. Relationships between longevity and linear type traits in Holstein cattle population of Southern Africa. Trop Anim Health Prod. 2004;36:807-14. DOI: 10.1023/b:trop.0000045965.99974.9c
[31] Sabuncuoglu N, Coban O. Relationship between udder and teat conformation and milk yield performance in dairy cows pre- and post-milking. Can J Anim Sci. 2007;87:285-9. DOI: 10.4141/A06-074
[32] Davis SR. TRIENNIAL LACTATION SYMPOSIUM/BOLFA: Mammary growth during pregnancy and lactation and its relationship with milk yield. J Anim Sci. 2017;95:5675-88. DOI: 10.2527/jas2017.1733
[33] Knight CH, Dewhurst RJ. Once daily milking of dairy cows: relationship between yield loss and cisternal milk storage. J Dairy Res. 1994;61:441-9. DOI: 10.1017/s0022029900028363
[34] Magana-Sevilla H, Sandoval-Castro CA. Technical note: Calibration of a simple udder volume measurement technique. J Dairy Sci. 2003;86:1985-6. DOI: 10.3168/jds.S0022-0302(03)73786-2
[35] Lin LI. A concordance correlation coefficient to evaluate reproducibility. Biometrics. 1989;45:255-68. DOI: 10.2307/2532051
[36] Lin L. Overview of agreement statistics for medical devices. J Biopharm Stat. 2008;18:126-44. DOI: 10.1080/10543400701668290
[37] Ferguson JD, Galligan DT, Thomsen N. Principal descriptors of body condition score in Holstein cows. J Dairy Sci. 1994;77:2695-703. DOI: 10.3168/jds.S0022-0302(94)77212-X